
Streamlit + Altair + Plotly 🎈
At Streamlit, we're constantly inspired by other open-source projects.
We're especially inspired by Altair and Plotly and their contributions to the data visualization community. They're two of the most popular Python libraries for creating interactive charts in Python—and in Streamlit. We continuously work to support them in our library, as Streamlit's success is due in no small part to their powerful and flexible charting capabilities.
Introducing a beautiful new Streamlit theme 🧑🎨
Today, we're excited to announce the release of a new default theme for Altair and Plotly charts in Streamlit apps!
The theme uses Streamlit's signature colors and layout adjustments that will make your data visualizations more engaging and easier to understand. Plus, your charts will better integrate with the rest of your app's design.
Check out our release demos for Altair at altair.streamlit.app and plotly.streamlit.app for more examples.
Psst…night owls and dark mode fans—we've got you covered, too! 🌚
How can you try it? 👩💻
You don't need to do anything!
The new theme is available from Streamlit 1.16 through the theme="streamlit" keyword argument in st.altair_chart, st.vega_lite_chart, and st.plotly_chart. It's activated by default, so there is nothing you need to do to enjoy it. ✨
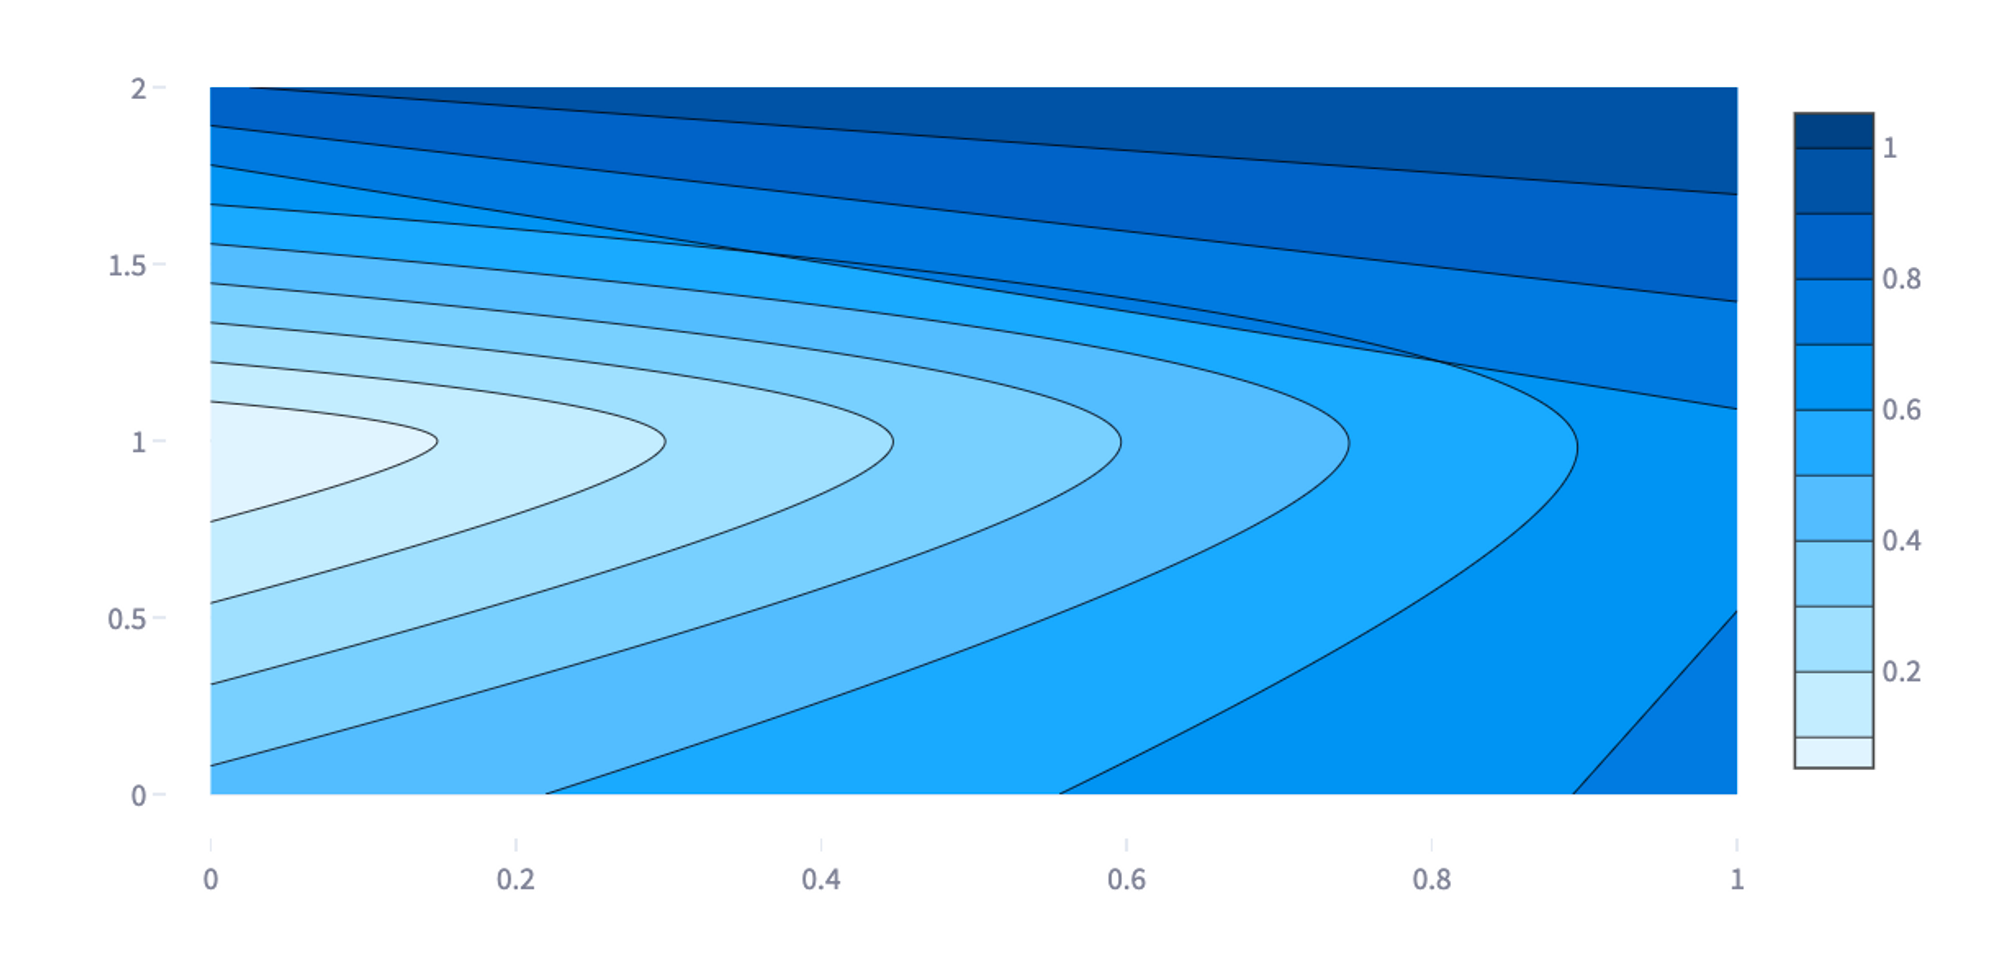
Here's a minimal example of a contour plot with Plotly:
import numpy as np
import plotly.graph_objects as go
import streamlit as st

z = np.random.random_sample((3, 2))
fig = go.Figure(data=go.Contour(z=z))

st.plotly_chart(
    fig,
    theme="streamlit",  # ✨ Optional, this is already set by default!
)
You can customize it
If you're an experienced Altair or Plotly user and like customizations, don't worry. Although we now enable the Streamlit theme by default, you can overwrite it with custom colors or fonts. For example, if you want a chart line to be green instead of the default red, you can do it!
Check out some customization examples in Altair and Plotly.
You can disable it
If you want, you can continue using the default theme. Just type theme=None instead of theme="streamlit" in your chart commands:
st.altair_theme(..., theme=None)
To learn more about our charts, visit our Altair, Plotly, and Vega-Lite chart docs!
Wrapping up
We're confident that your users (and you!) will love this new default theme. Go ahead and give it a try. And check out the other features released in 1.16.0.
Happy Streamlit-ing! 🎈


Comments
Continue the conversation in our forums →