
Hey, community! 👋
We are Sven and Mathias, semantic data processing researchers. Since 2007, we have been studying the machines’ ability to understand natural language—this was before AI was cool. Our dream was to provide technology that could quickly and efficiently filter through the noise, leaving only the most relevant and helpful information. Fast forward to 2017. We found semantha and built an adaptive AI for text-driven processes.
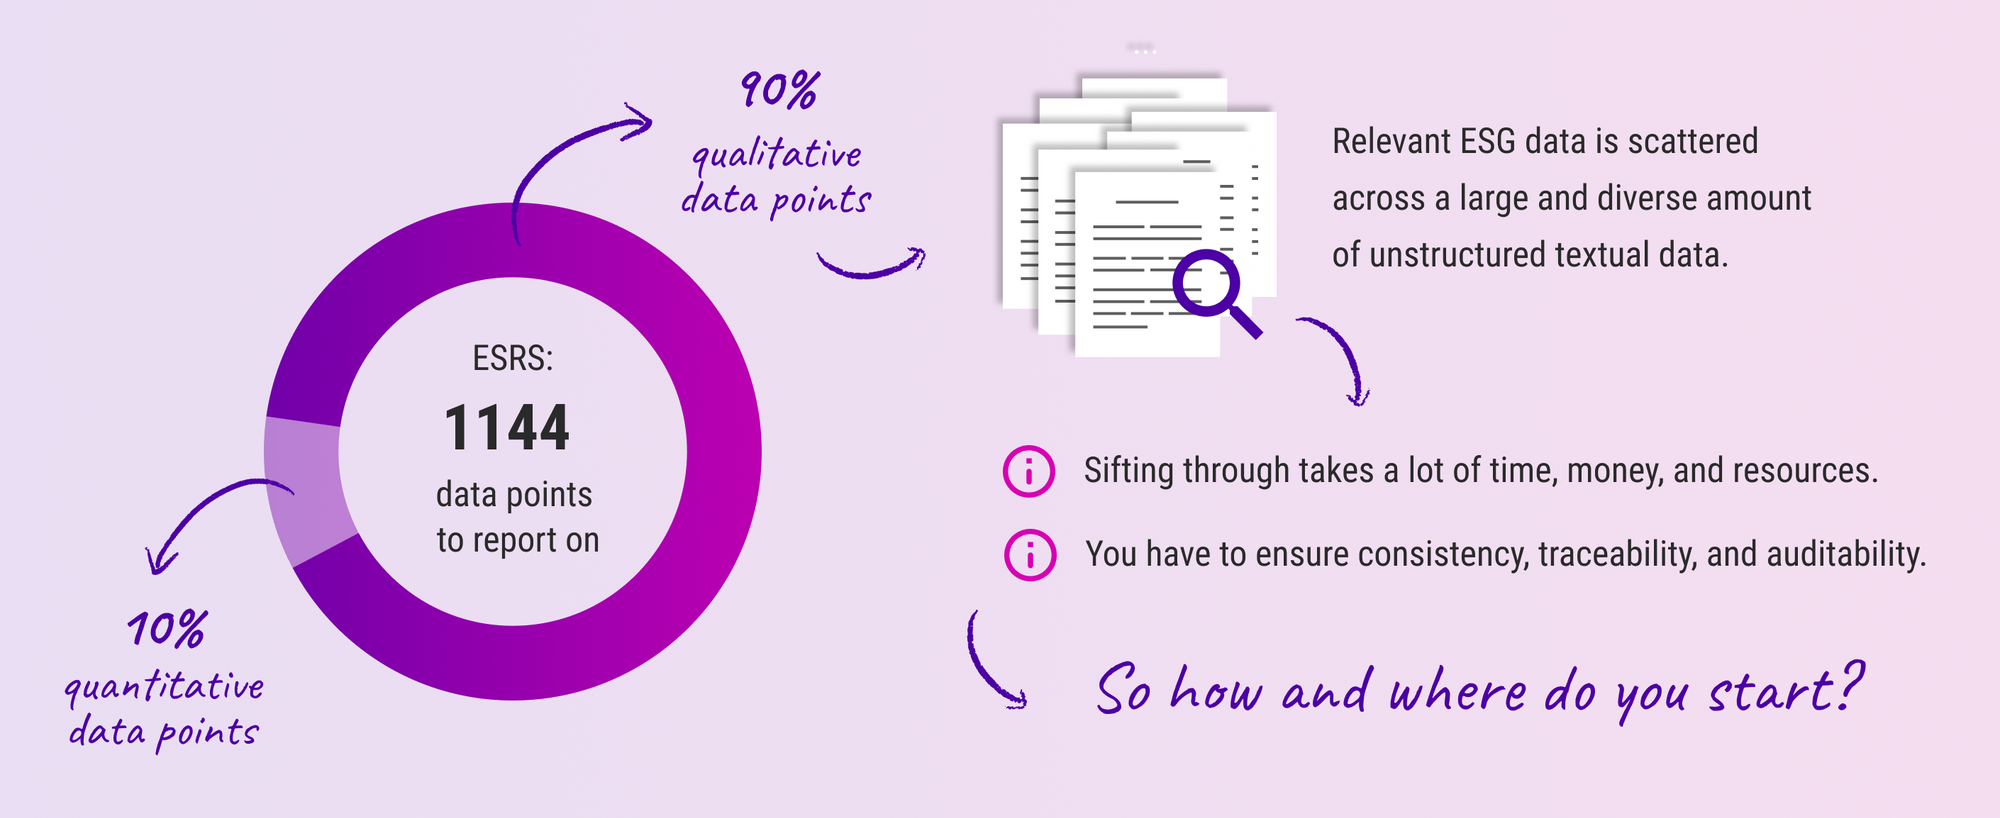
Then last year, we chatted with Snowflake, and the topic of Environmental, Social, and Governance (ESG) reporting came up. We talked about how it’s riddled with manual document processing once you go beyond quantitative KPI—which you’re required to do. To do it correctly, you must assess the entire reporting standard, but companies often look only at the easy 10%—financial KPI, gender pay gaps, greenhouse gas emissions, etc. All that is computed from structured data like your basic Excel spreadsheets. The other 90% is buried in the documents like labor law, safety, health insurance, internal policies, and so on.
The short of it is, most companies don’t provide complete and accurate reports.
Ouch.
After this talk a lightbulb came up in our heads (or two?) 💡 💡
What if we pulled data from Snowflake, did the analyses with semantha, and displayed the results in a beautiful Streamlit app?
So a week later, we built it, deployed it, and it’s running. We called it K-A-T-E One.
In this post, we’ll show you the fundamentals of the app, how to use it, and what insights to gain from your data. Let’s get started!
App overview
K-A-T-E One can fetch ESG-related content from Snowflake, perform a coverage analysis using semantha, and answer questions like these:
- How to jumpstart our reporting process?
- What do we already have in place to report on?
- What is in a given annual report or draft (and what is missing)?
- Where does the information come from? That’s a valid question.
Here is how it works:

Here is how you’d use it:
- Connect the app to Snowflake
- Choose the documents to be analyzed and get a breakdown of the included topics. For each document, an overview will highlight the covered topics and identify any missing ones.
- Select a single document for in-depth analysis. See a topic distribution (Altair bar chart) and the highlighted topics broken down by ESG reporting category in a sunburst chart (Plotly).
Go ahead and play with it:
Now, let’s get to coding!
Step 1. Connect to Snowflake and get the Documents
Connecting to Snowflake is easy. All you need are the Snowflake SDK and valid credentials. We store our credentials in Streamlit secrets.toml (per Streamlit docs).
st.secrets dictionary.Because we used sections, we used the dictionary:
[snowflake]
account   = "account.region"
user      = "myuser"
role      = "myrole"
password  = "************"
warehouse = "my.example.warehouse"
database  = "mydb"
schema    = "myschema"
stage     = "ESG_DEMO"
To begin, import the Snowflake libraries and access the st.secrets dictionary. Then, open a connection and fetch the document list from the configured stage:
import snowflake.connector as snowconnector

def is_analyzable(filename):
    return filename.endswith(".pdf") or filename.endswith(".txt") or filename.endswith(".docx")

ctx = snowconnector.connect(st.secrets.snowflake)
with ctx.cursor() as cur:
    cur.execute("SELECT relative_path FROM directory(%s);", (st.secrets.snowflake.stage,))

    # This is how you'll get a list of all files
    result = cur.fetchall()

    # We filter the file types so that we only use text in the demo
    # and take only the first 20 that we want to read...
    # If you expect many files, you wouldn't use the filter and then trim the list
    # but append analyzable files one by one until you reach the size limit to
    # avoid checking files that you'd then throw away anyways (see the code in
    # the GitHub repository for details)
    filtered = [element for element in result if is_analyzable(element)][:20]
That's it! Now you have a list of documents you can analyze for ESG content.
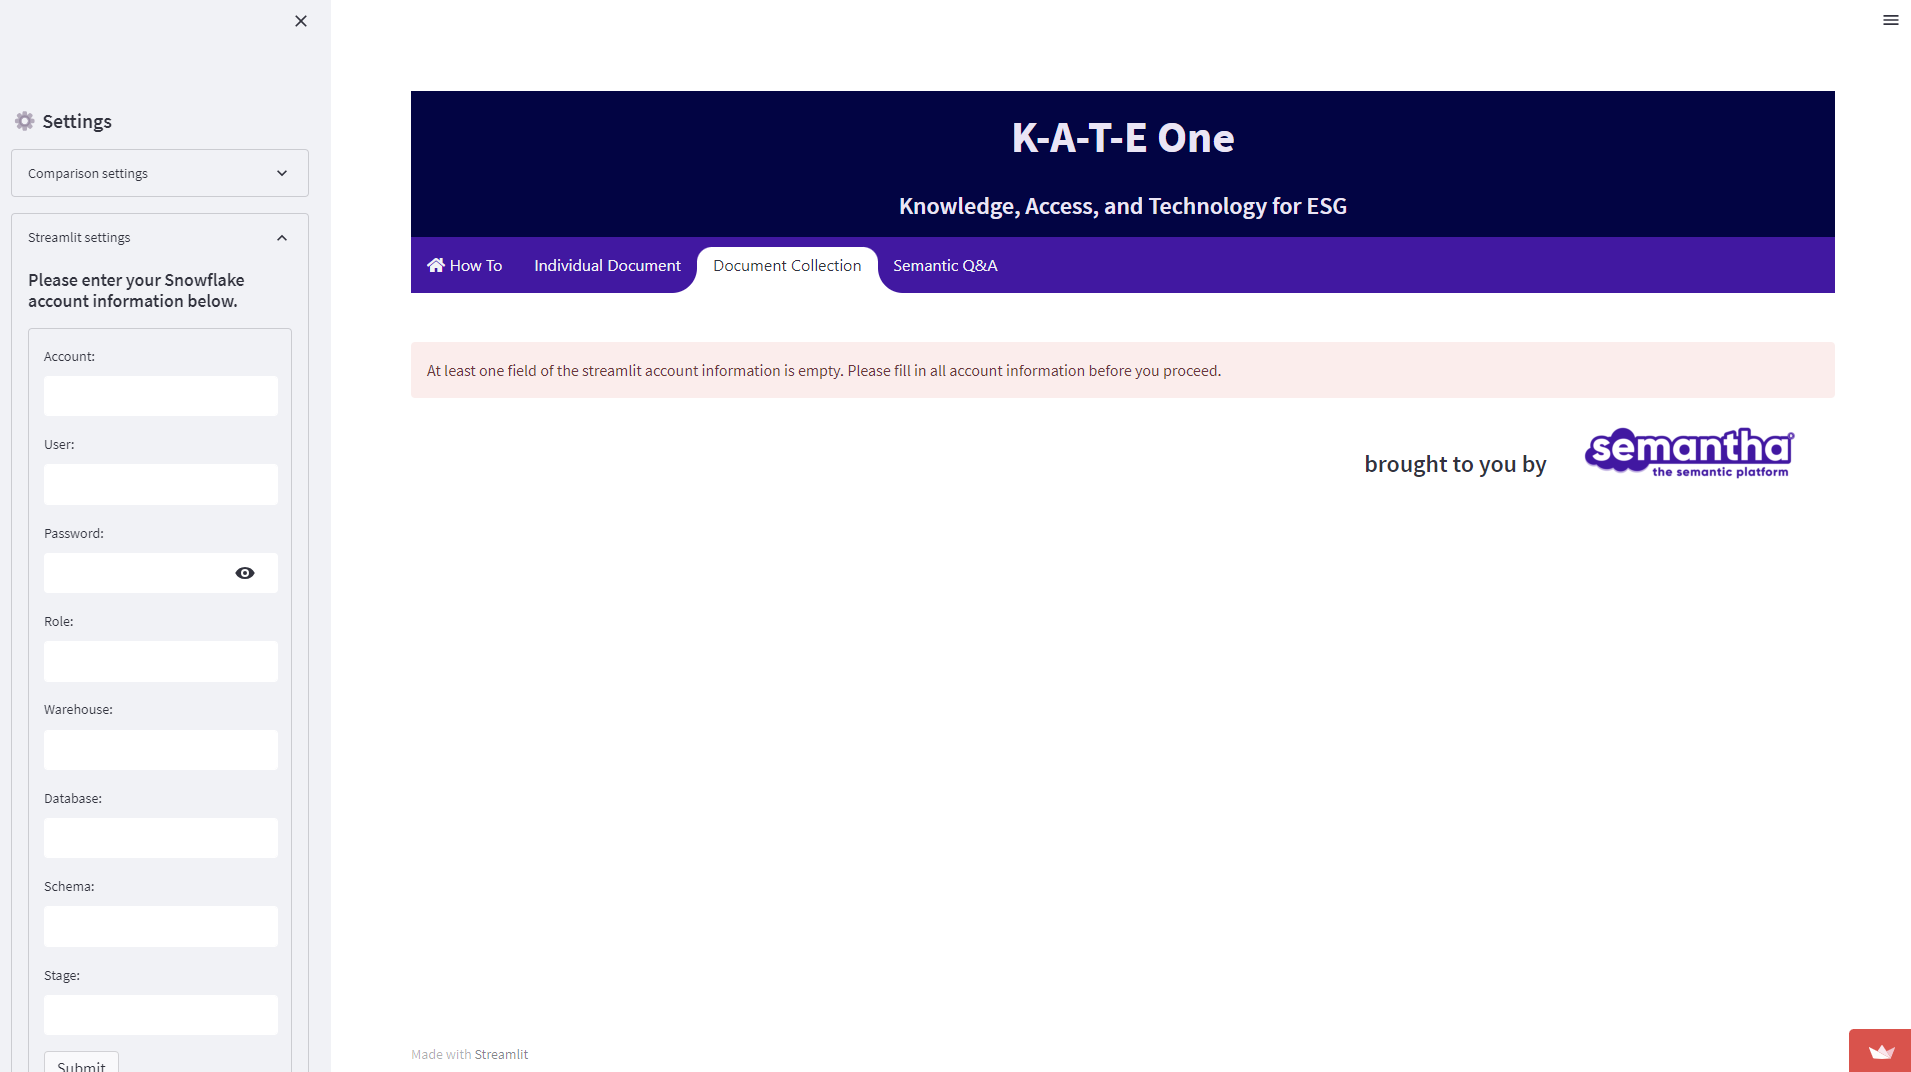
On the UI side, connecting is easy. Just fill in your connection details in the sidebar:
Once you connect to Snowflake, the app will load the first 20 documents and display a preview:
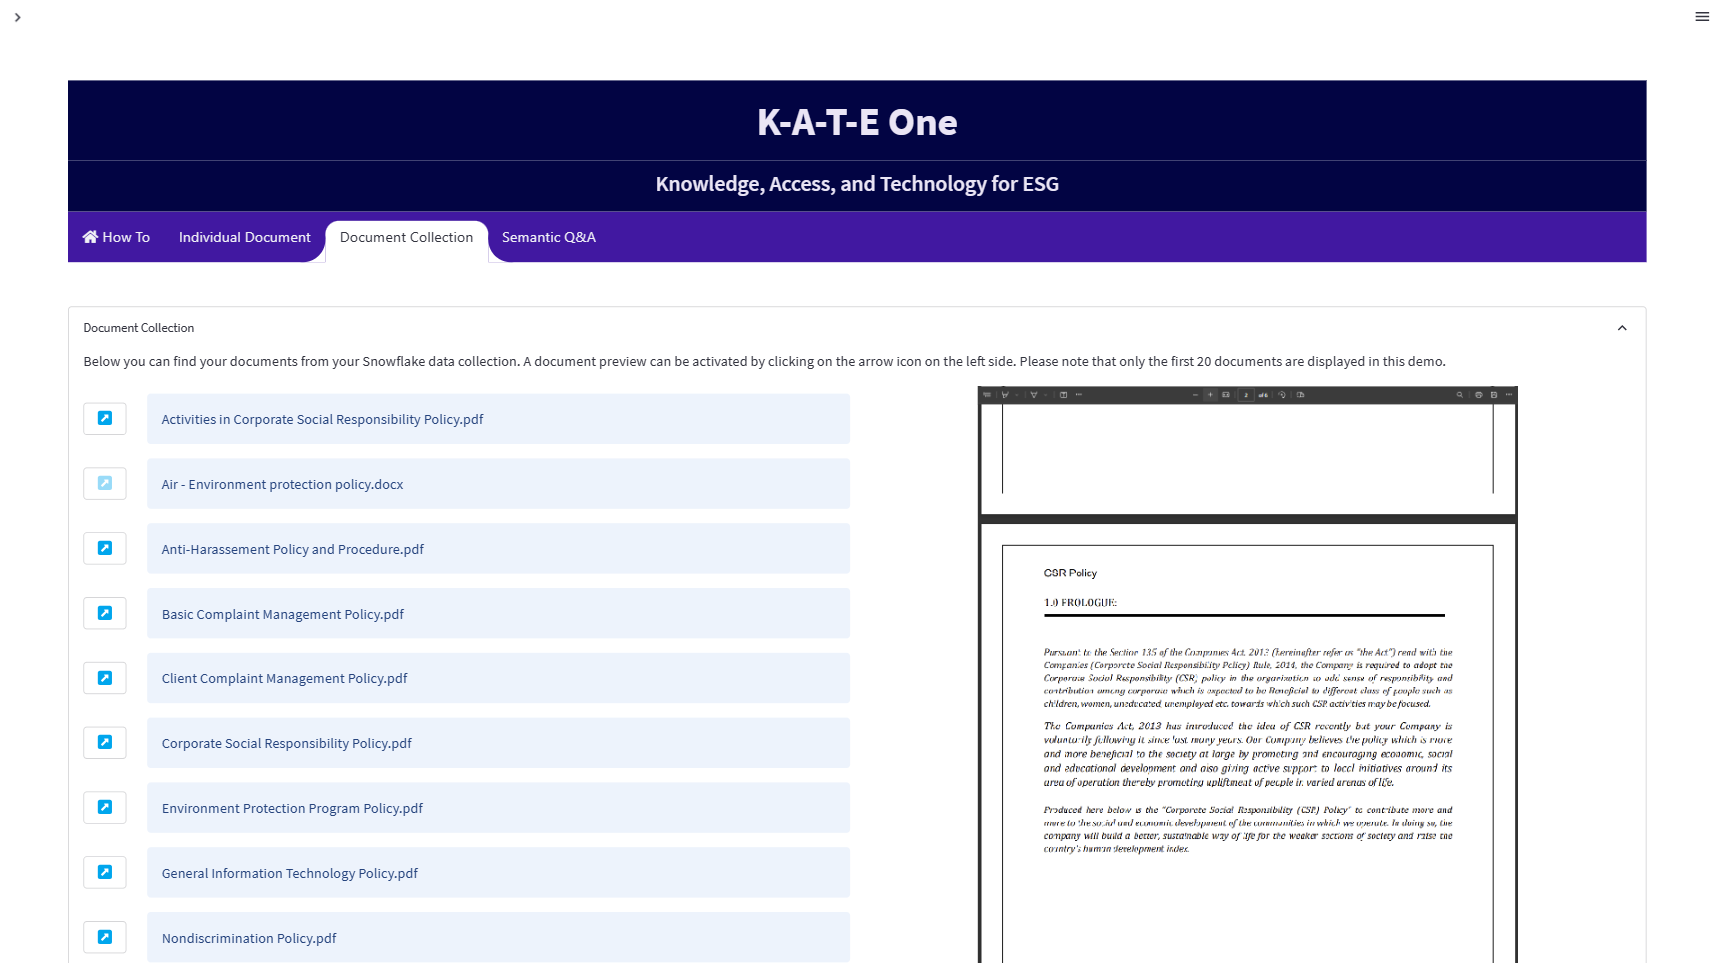
To keep this brief, we filtered file types to show only PDFs, plaintext, and docx files and set the document number to 20. In your app, you can remove these limitations.
Step 2. Connect to semantha and feed the documents into the consolidated analysis
To prepare the app, we trained semantha to perform ESG-related analyses. The background knowledge is stored in semantha's library (similar to books 📚, not like a program library 🤖), hence the term "library" in the following code snippet. We'll focus on the EGS example for this post, but you can modify it for other purposes.
As in Step 1, utilize Streamlit's secrets.toml to store the semantha credentials (K-A-T-E One is pre-authenticated, so provide your credentials only if you use your own private instance):
[semantha]
server_url = "<https://example.semantha.systems>"
api_key = "YOUR_API_KEY"
domain = "ESG_DEMO"
Next, fetch the binary documents from Snowflake one by one and feed them to semantha to obtain the corresponding results (in Step 1, you only collected the file names and locations):
import streamlit as st
import semantha_sdk

def analyze_doc_collection(semantha, documents):
    my_bar = st.progress(0.0, text="Analysis running. This will take some time!")
    increment = 1 / len(documents)
    for i, doc in enumerate(documents):
        __curr_file_name = doc.get_name()
        my_bar.progress((i + 1) * increment, text=f"Analysis running... Processing file '{__curr_file_name}'")
        results = semantha.domains(domainname=st.secrets.semantha.domain).references.post(
            file=doc.as_stream(),
            similaritythreshold=0.9,
            maxreferences=1
        )

        # [...]
        # process and display results - see GitHub :)

# Connect to semantha
sem = semantha_sdk.login(
    server_url=st.secrets.semantha.userver_url,
    key=st.secrets.semantha.api_key
    )

# Run the analysis
analyze_doc_collection(sem, filtered)
Lines 10-14 in the code snippet above are important. The app sends a file to semantha using the references endpoint of the API through an HTTP POST request. The selected domain ESG_DEMOcontains the library with our background knowledge. semantha analyzes the file and discards all findings except one (maxreferences=1) and findings with lower confidence (threshold=0.7).
Next, produce a sunburst chart and a table with the document topics. We used ESG reports for the analysis to show which ESRS facets are covered, where (sunburst chart in Step 3), and which facets are missing (document breakdown below the chart).
In the user interface, click on "Analyze Document Collection." If you want to skim-read, open them in the embedded PDF reader beforehand.
Here is what the results will look like:
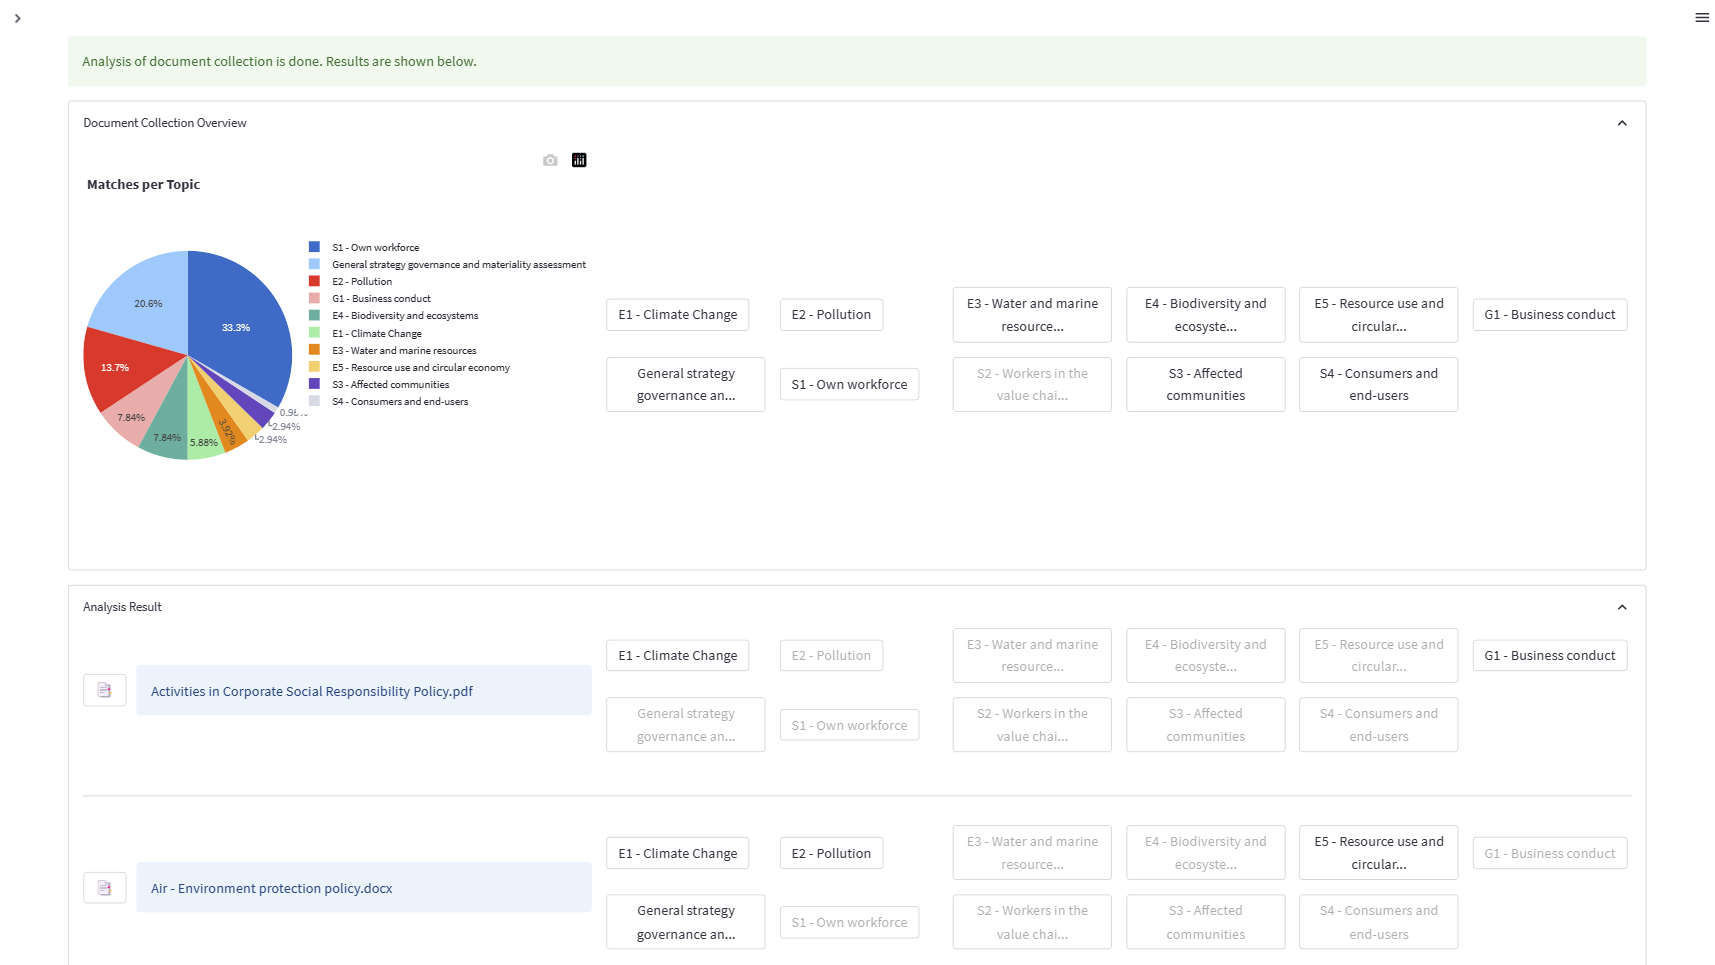
You can see the high-level topics in each document, with active and inactive buttons indicating whether a topic is covered. To see how a document covers a topic, click on the analysis button next to the filename and navigate to the "Individual Document" tab.
Curious about the button functions? Click on them or check out the Bonus section below. 😉
Step 3. Drill down into a single document
Want to get into the details? Drill down into any document. See what ESRS-related content you already have and what's missing. It'll help you steer your reports and better understand how well the competition is performing. No one said you must use your data to process with K-A-T-E One. 😉
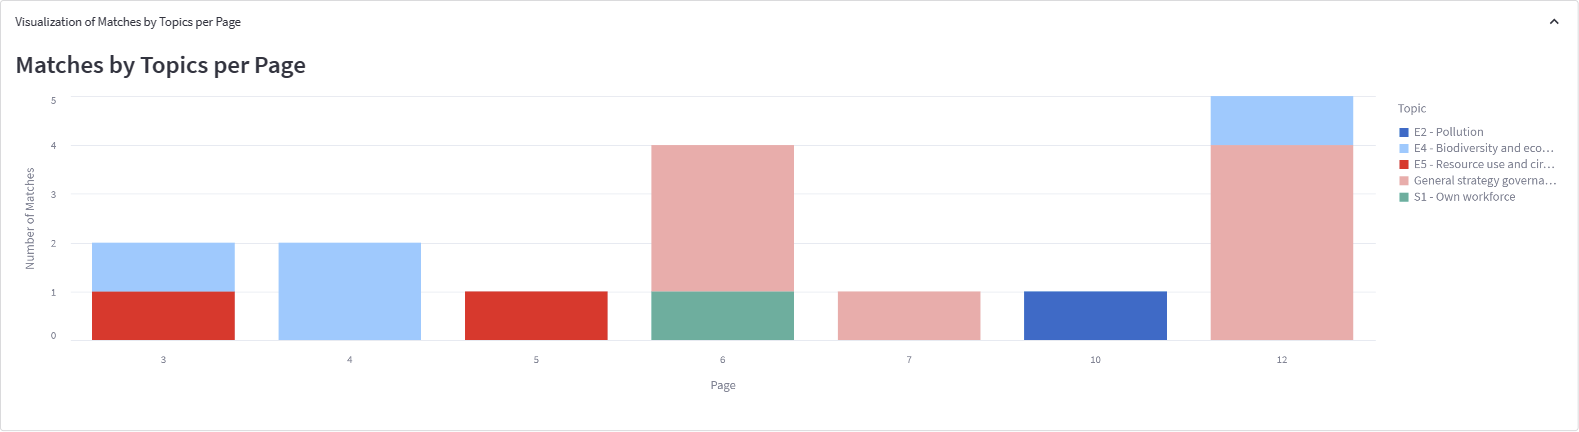
If you want to do an individual analysis of a single document, start with the bar chart. It shows one bar per page that contains relevant content. You'll get a quick document overview. Does it mainly talk about a single topic, or is it rather a high-level document covering multiple topics?
Scroll down to see an overview of the topics covered on the left and a breakdown of the specific ESRS facet covered (and not covered) by the document on the right.
In this example, the document doesn't cover the topic "Affected communities" at all but contains statements related to the topic "Biodiversity and ecosystems" (which is not surprising, given that the document is called "Environment Protection Program Policy (EPPP)"). And while some facets of the ESRS topic are covered, other essential facets are missing.
You must decide:
- Are these missing facets not important to the EPPP?
- If they're important, should they be covered elsewhere?
- Could they be a sensible extension of your policy?
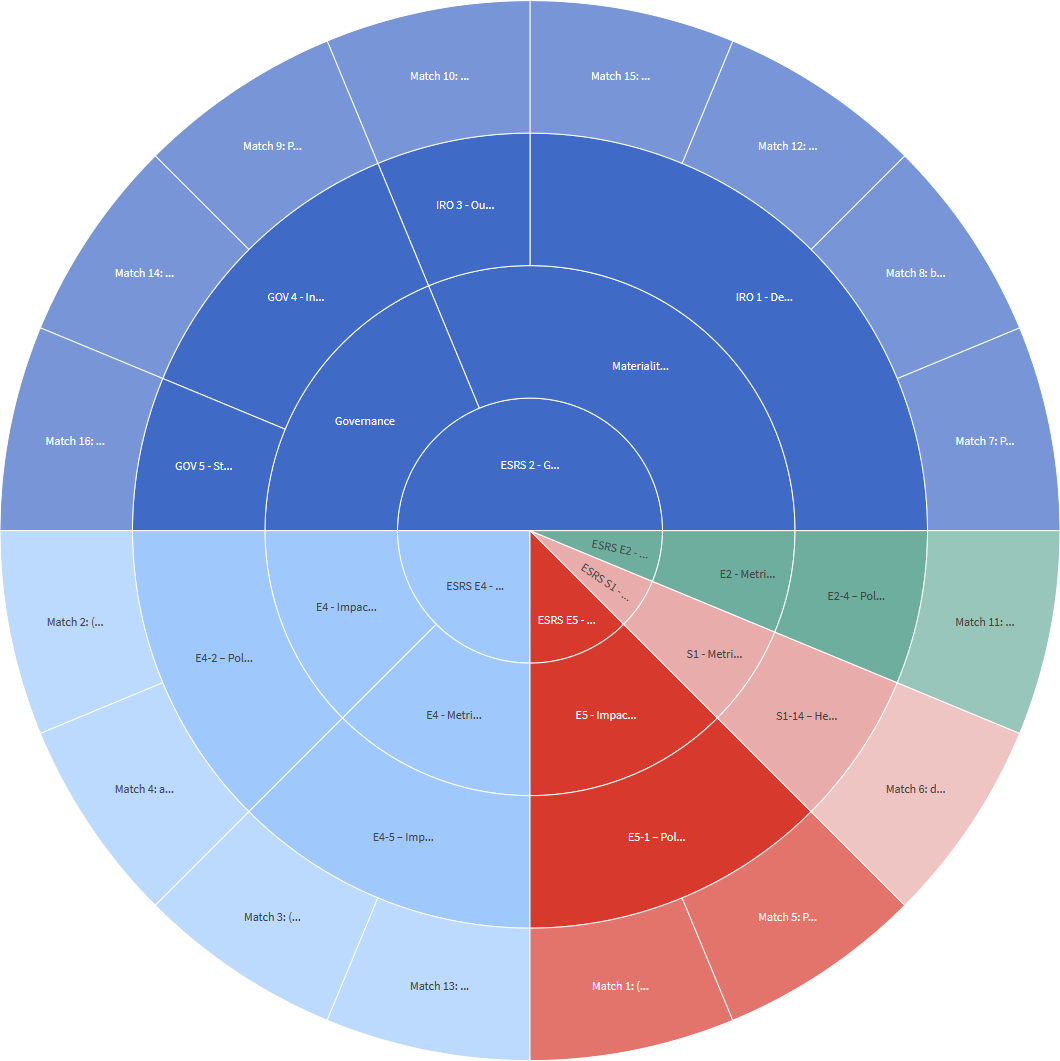
Scroll down some more for a sunburst chart that details the coverage of ESRS topics, broken down from the highest hierarchy level (in the center of the chart) down to the individual facet (second ring). The outermost ring includes the actual snippet from the document.
As you can see, the document mainly focuses on governance (top half of the chart). ESRS 2 focuses on measuring and monitoring aspects of EPPP, including governance. The bottom left quarter covers the policy topic of "ESRS E4 / Biodiversity and Ecosystems". EPPP also addresses handling pollutants by the workforce but with less emphasis than other topics.
Step 4. Identify documentation your company already has but doesn't know where
Nothing is worse than staring at a blank sheet of paper, wondering where to start and how to structure your thoughts.
To start your reporting, identify the important reporting aspects for your operation and stakeholders. Since ESG concepts are not new, there should already be some existing frameworks. To gain a deep understanding, perform the same analysis as in Step 2, but this time with all your data. Utilize your AI to guide you, identify covered areas, and you have your starting point. Let's face it, as does everyone else, you likely lack oversight of your ESG documentation.
Use the analysis results as a starting point for your materiality assessment. Prior coverage of these topics, even without reporting in mind, indicates their value or necessity to your business operation. Include them in any report you send out. Cross-reference the results of this analysis with your materiality assessment to identify what you have covered and areas that require further study or control.
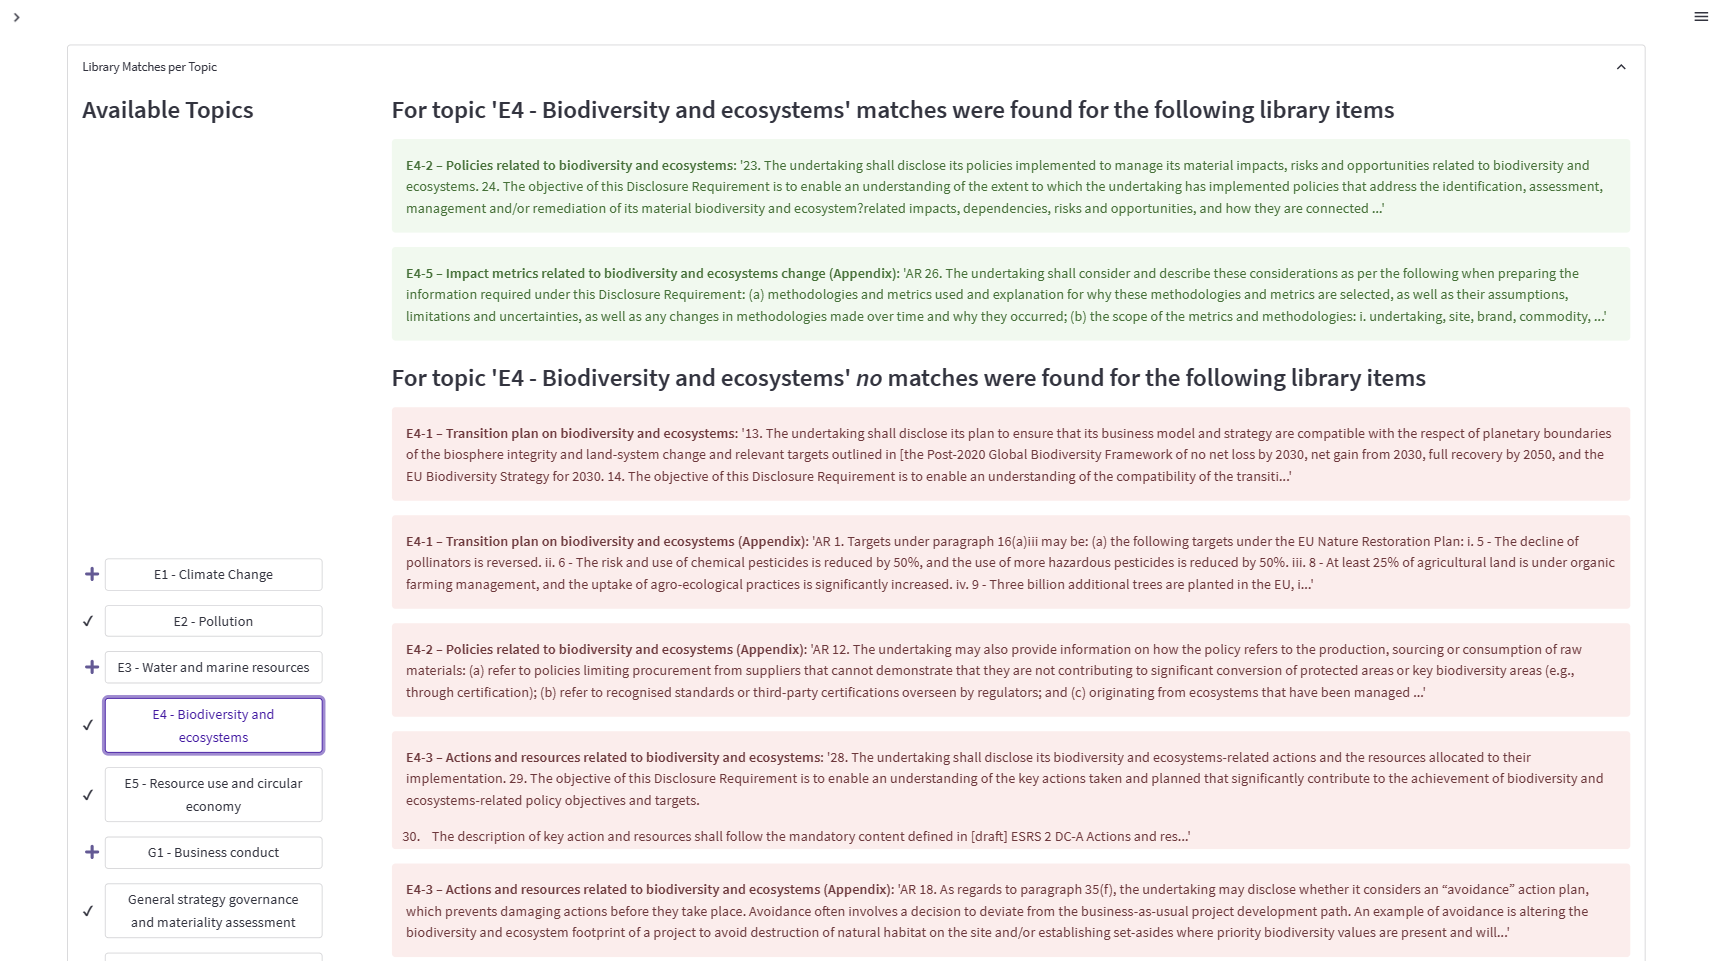
You can now get a breakdown of the ESRS facets, where you have already covered them, and where you didn't. Given the analysis in Step 2, you can identify topics that were not previously covered, drill down to individual paragraphs, and connect the dots across multiple documents to beef up your report.
With the help of AI, it's almost as much fun as a painting by numbers! 🖼️
Bonus. Generate text for your ESG report!
Now you can ask semantha to summarize the paragraphs, properly referencing your documents (below the consolidated analysis). Each ESRS topic covered in the analyzed documents can be summarized.
Just click a topic button in the document list and scroll down to the summary:
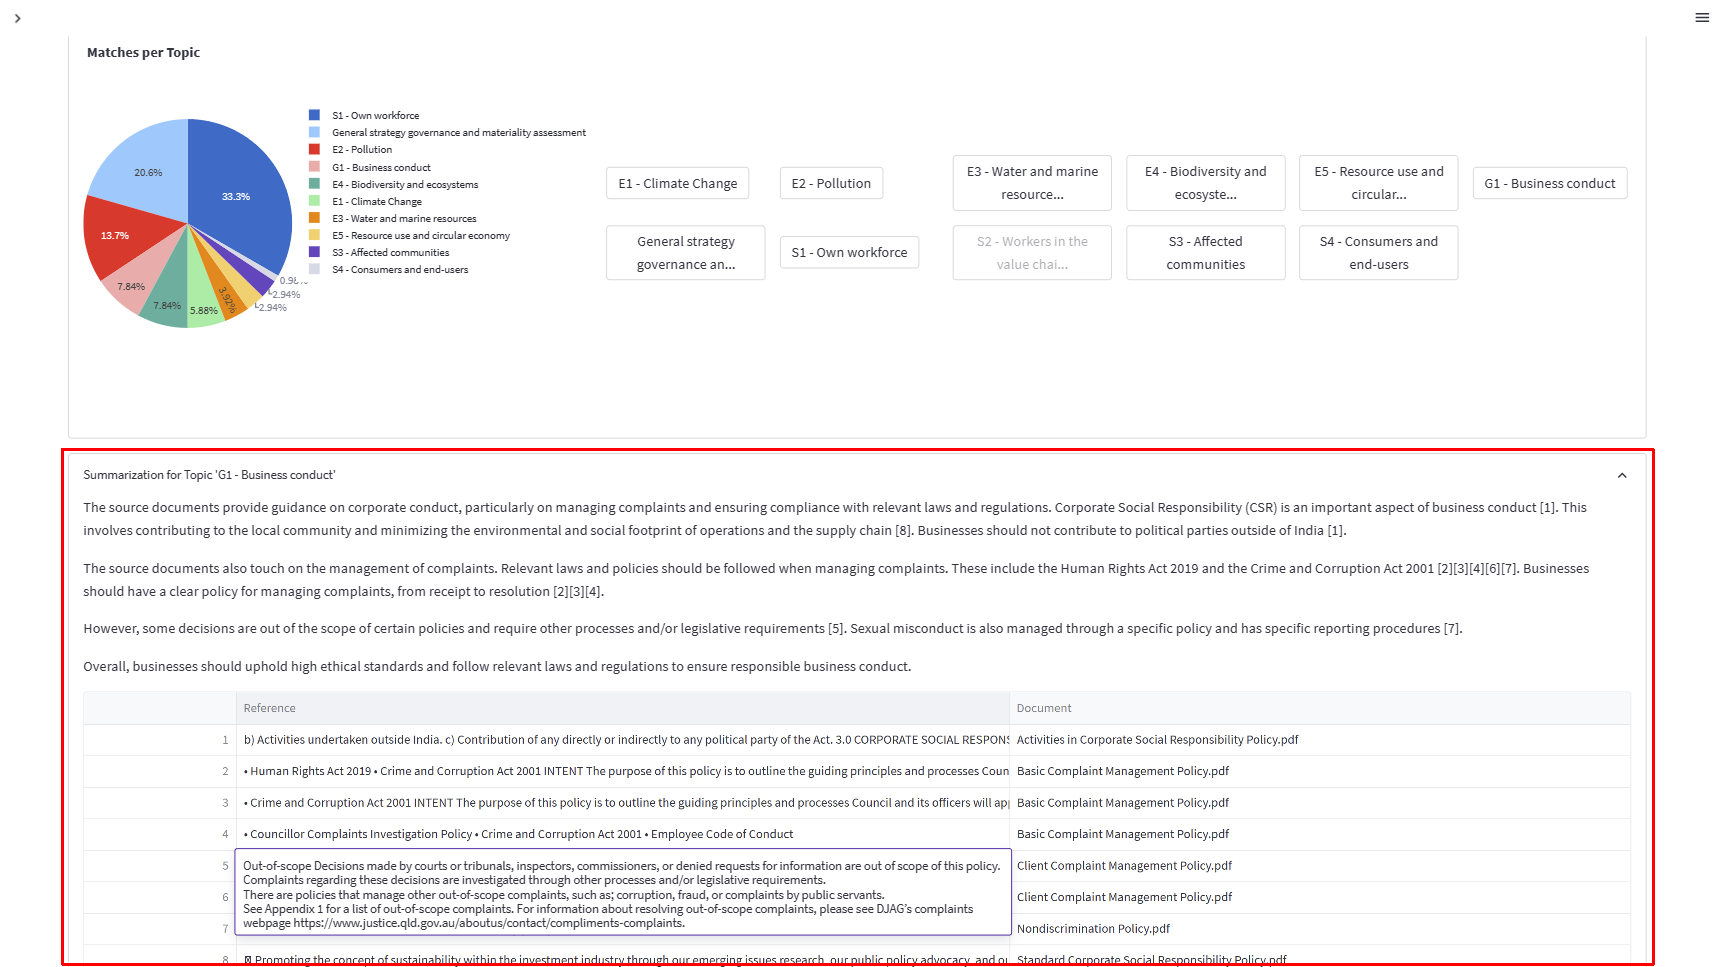
You can quickly prepare a draft report section based on qualitative data and auditable references. But you must first identify the ESRS facets relevant to your business operation. In Step 4, we demonstrated how to start or extend your materiality assessment based on available documentation.
You can also begin with the mandatory facets:
- ESRS 2 General disclosures (all disclosures)
- ESRS E1 Climate Change (all disclosures)
- ESRS S1 Own Workforce (subsets apply according to company size)
No AI is required to identify these facets. 😉
Wrapping up
Thank you for reading our post! You've seen that getting information from unstructured documents stored in Snowflake and visualizing the results is bliss when combining the powers of Streamlit, Snowflake, and semantha. We've shown how to fetch documents from Snowflake, push them to semantha for analysis using their respective Python SDKs, and view the results in a beautiful 💖 Streamlit app.
We've excluded a bunch of code to make the post easier to read. Feel free to clone it from our repo! The SDKs are public, too (go to snowflake-connector-python and the semantha-sdk to learn more).
If you have any questions, please post them in the comments below or contact Sven or Mathias on LinkedIn.
Happy Streamlit-ing! 🚀


Comments
Continue the conversation in our forums →