
Ever wanted to view the traffic levels of your Streamlit apps without using custom JS code? If so, today, we’re excited to announce...
The new Analytics Modal feature on Streamlit Community Cloud!
Now you can see how many views you’ve received, who has viewed your apps, and when.
In this post, we’ll show you how to use both Workspace analytics and App viewers analytics by using a fictitious Streamlit workspace as an example.
Want to jump right in? Head over to your Community Cloud account to view your analytics now.
Workspace analytics
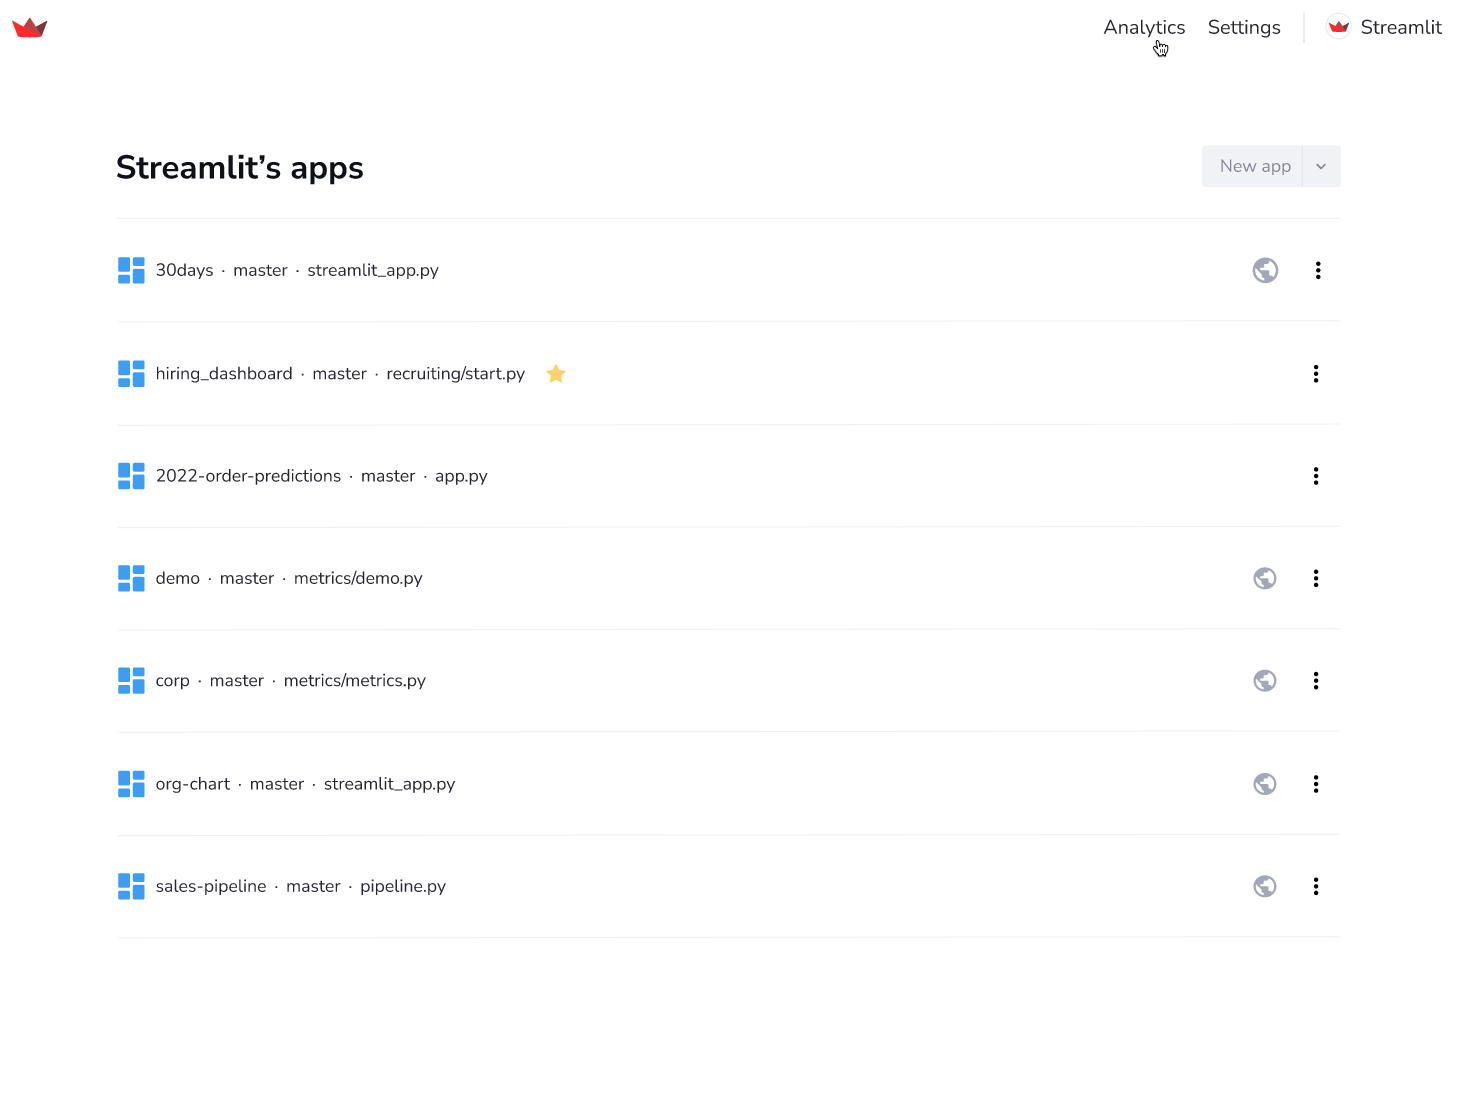
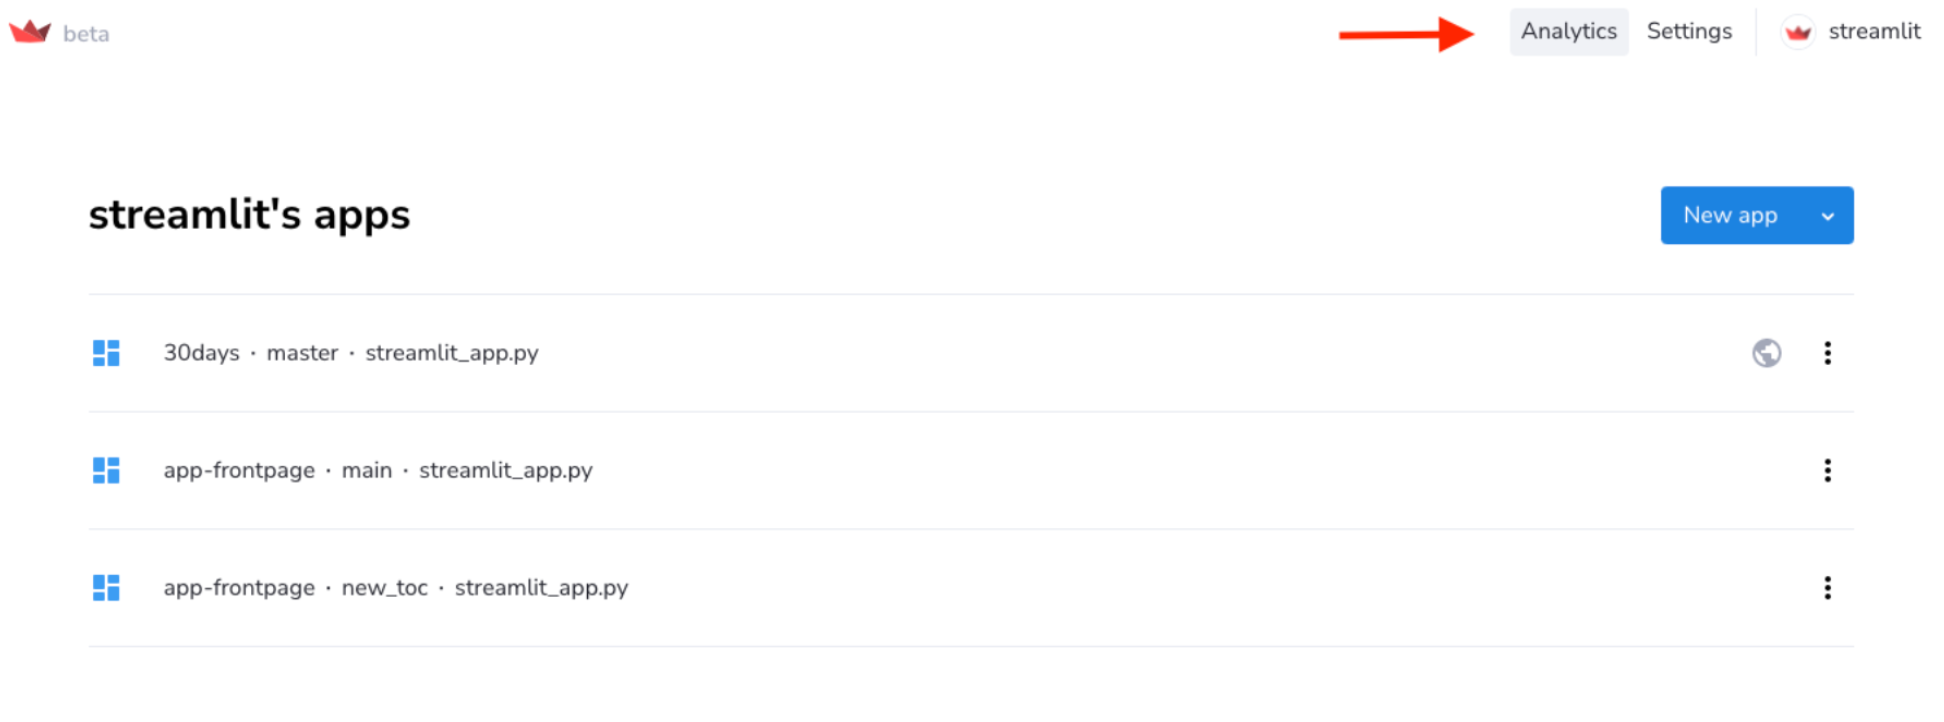
In Workspace analytics, you can see how many total viewers have visited all apps in your workspace. Simply click on "Analytics" in the dashboard header:
The modal will automatically open in your "Workspace" tab:
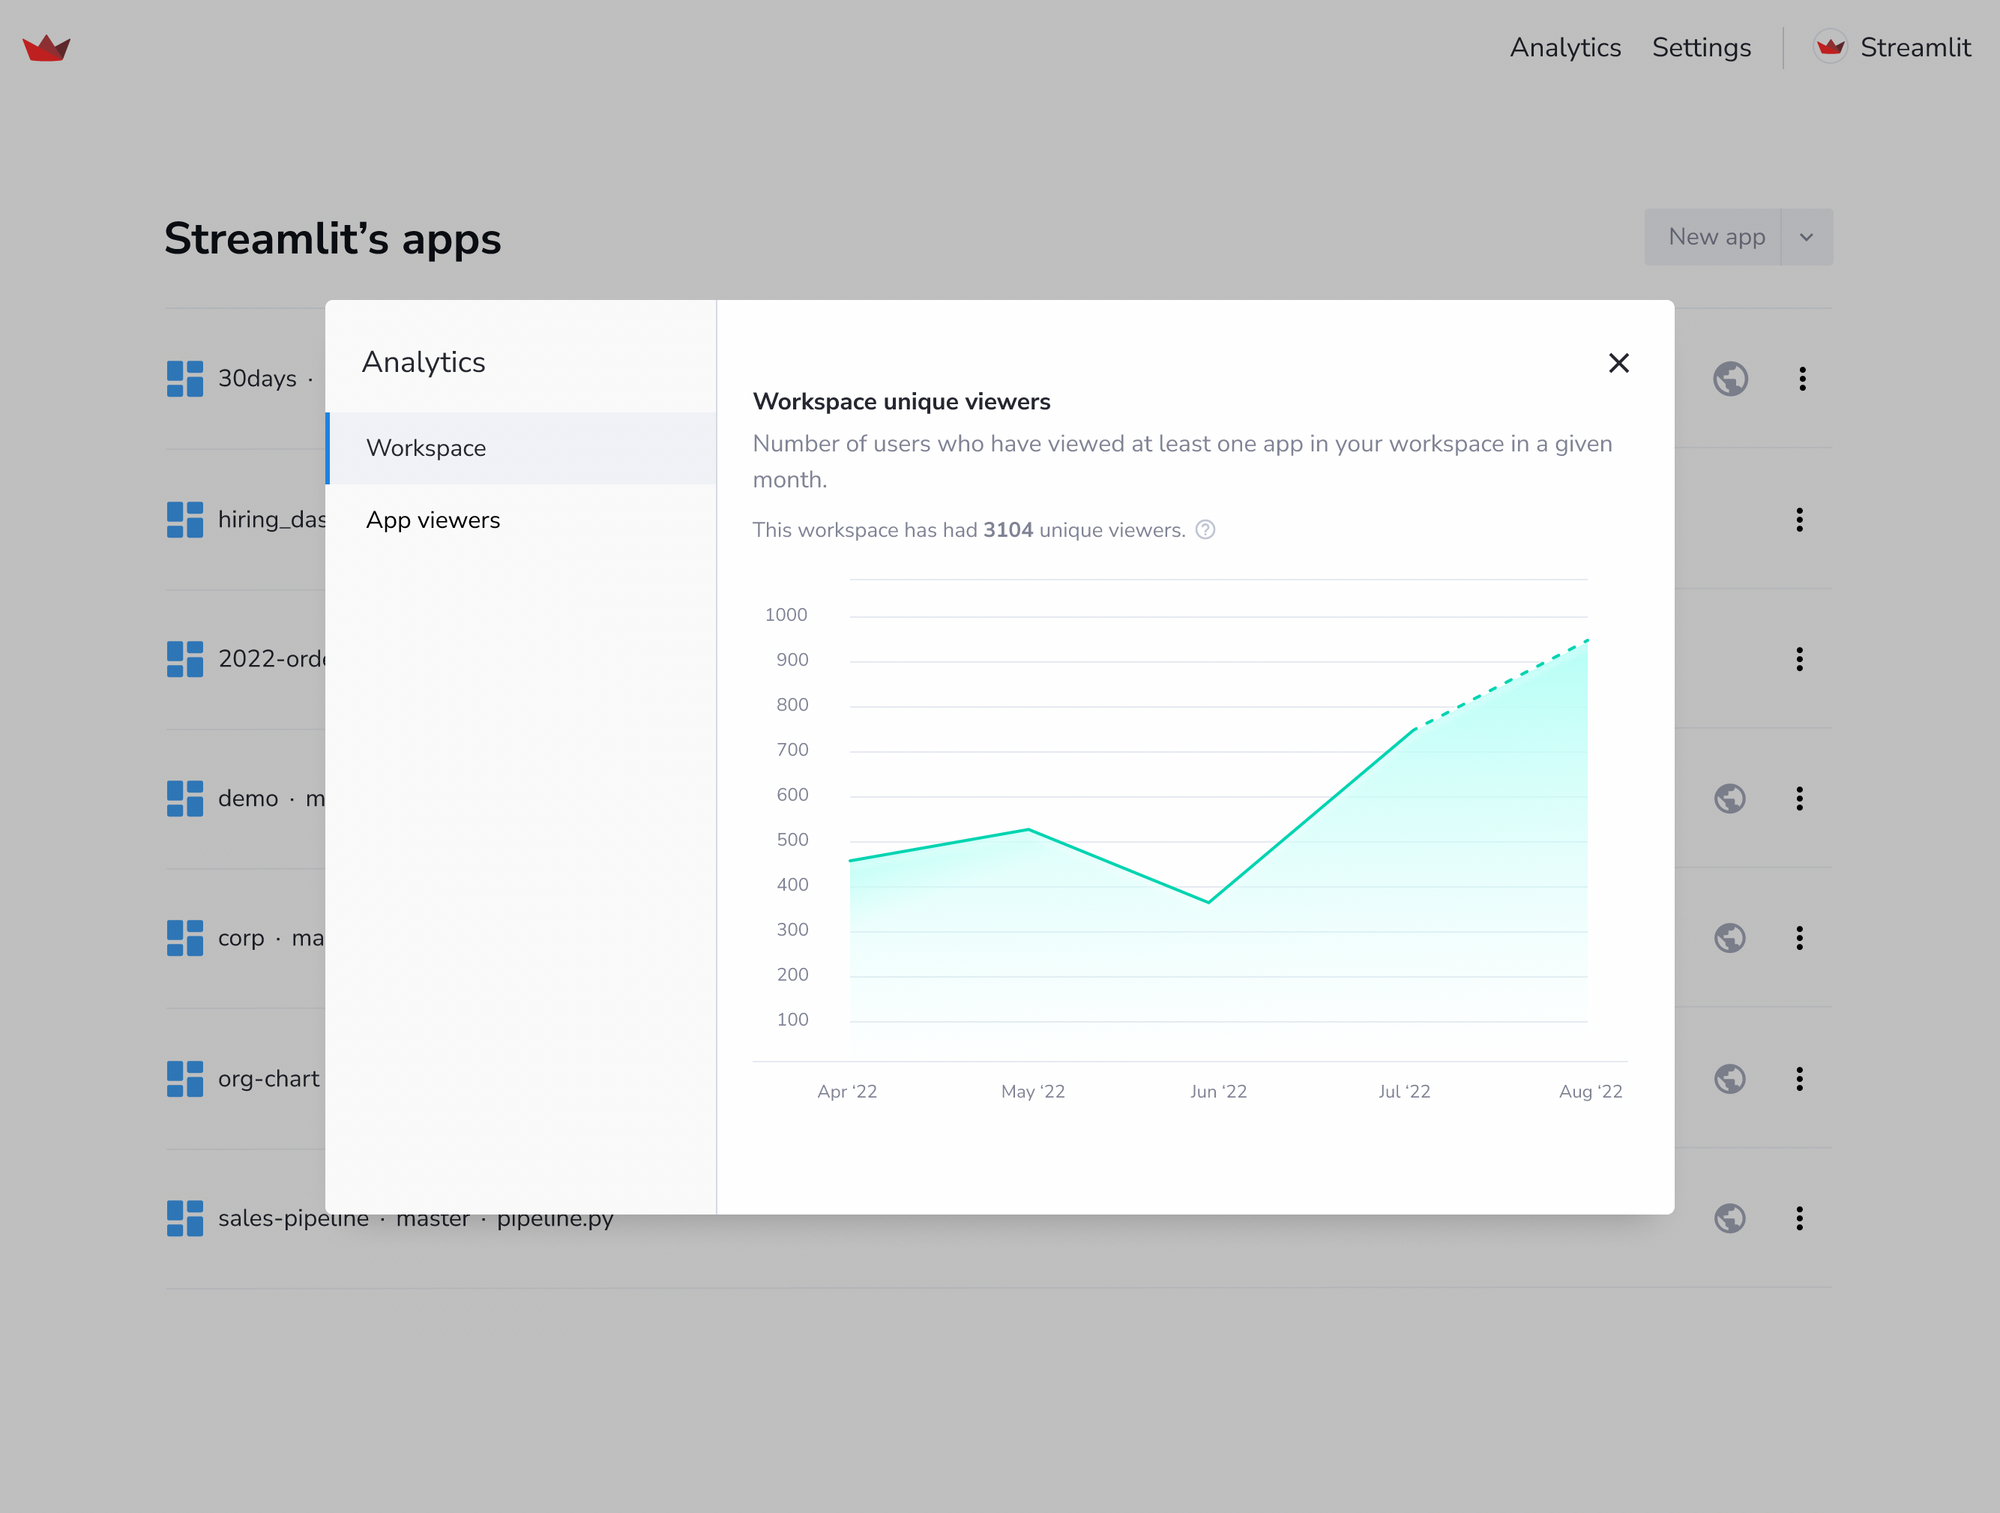
Let’s say that our fictitious Streamlit workspace has dozens of public apps. The solid line indicates the completed months and the dotted line indicates the month-in-progress for all apps in the workspace.
You can also hover over your "Workspace" tab’s chart to see how many users have viewed at least one app in a given month:
App viewers analytics
Head over to App viewers analytics to see who has recently viewed your apps and when.
We’ll use the 30 Days of Streamlit app as an example (we launched it in April for the community to learn more about Streamlit and to try fun use cases).
You can access App viewers analytics in three ways:
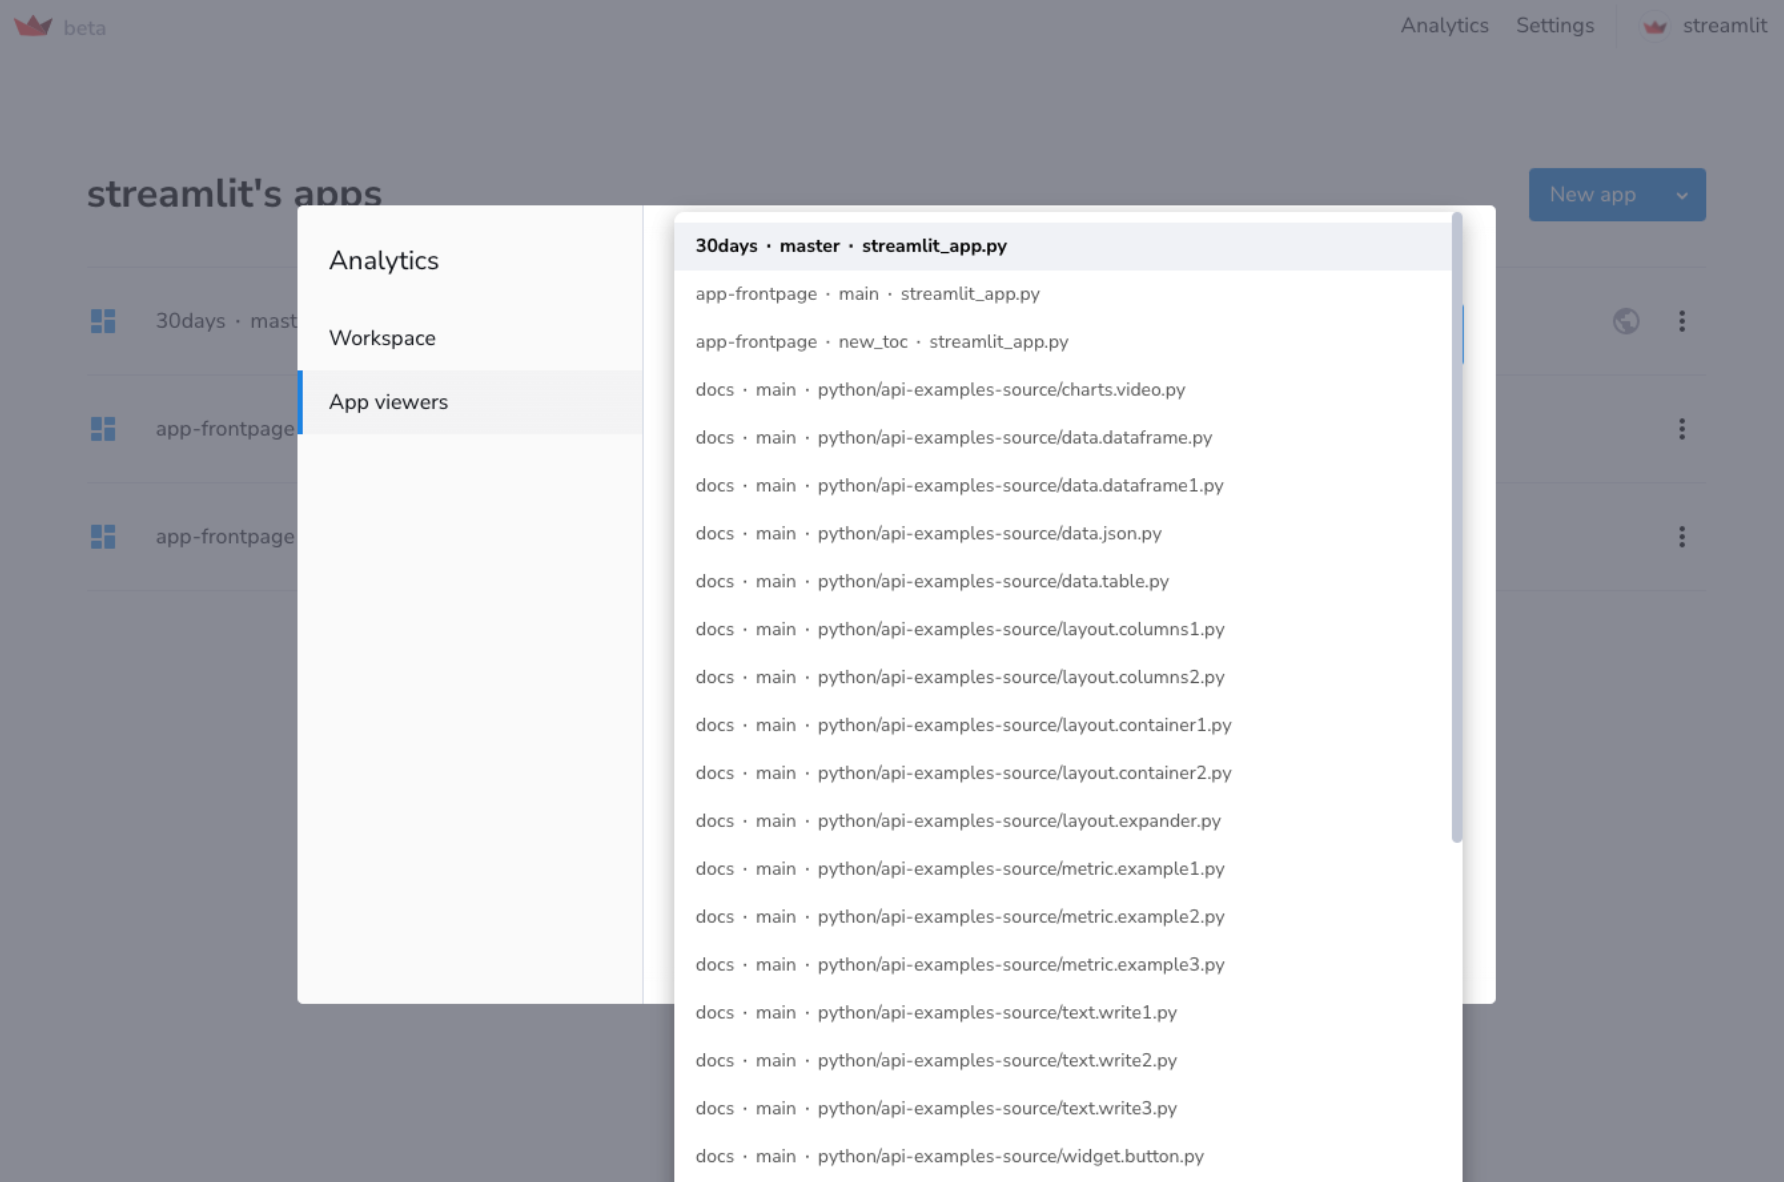
- In your workspace, click the "Analytics" tab and then the "App viewers" tab:
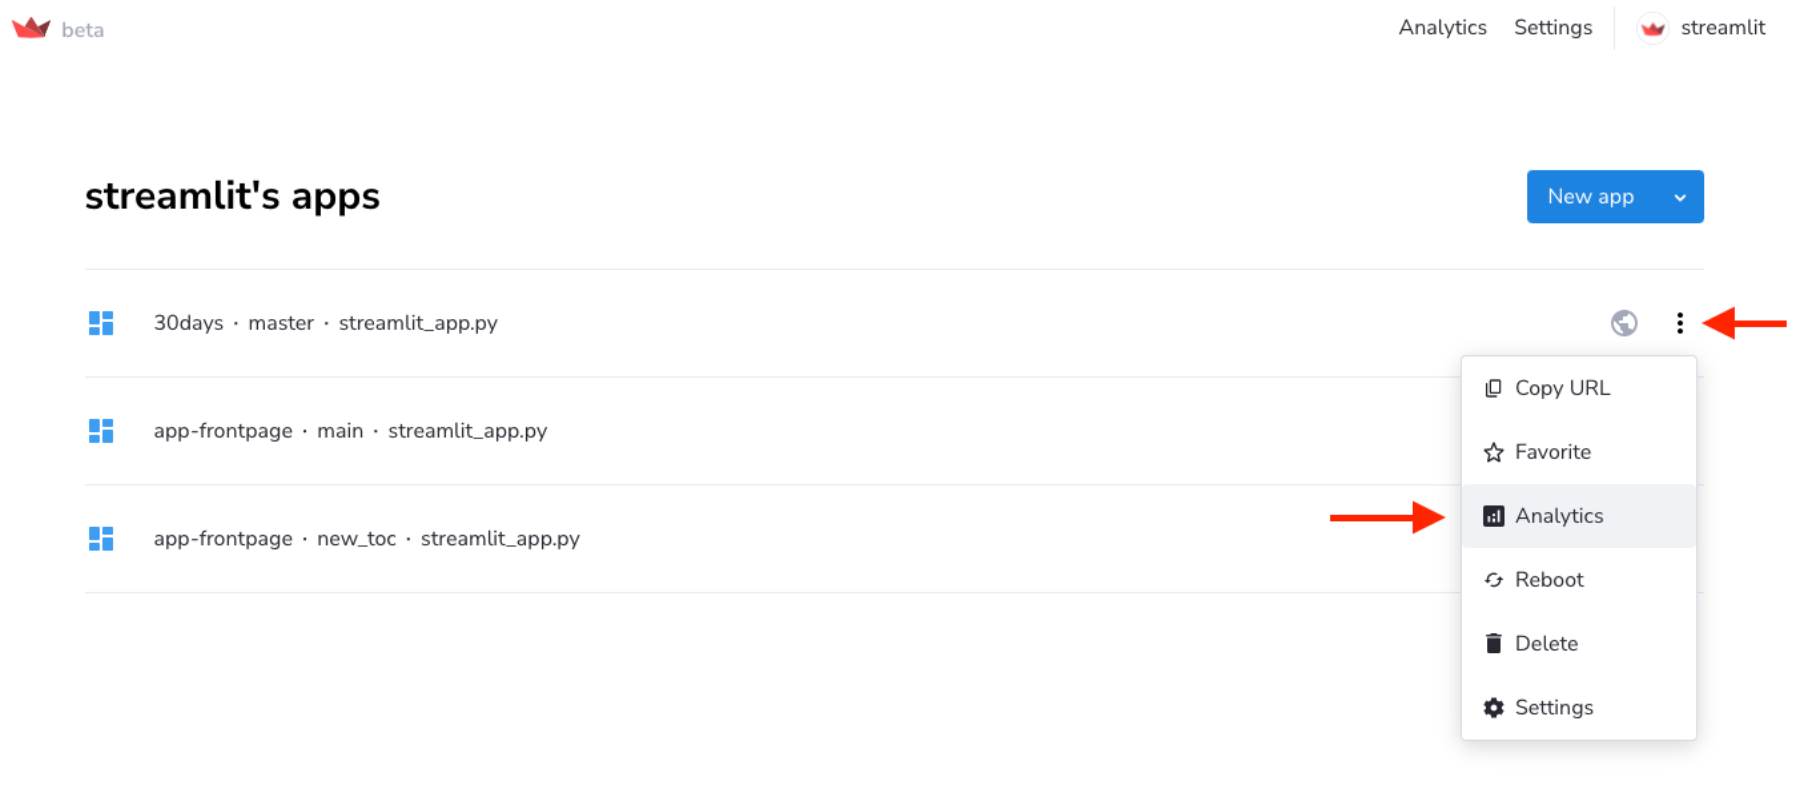
2. From your "Apps" dashboard, click the "︙" overflow menu for any app, then select "Analytics":
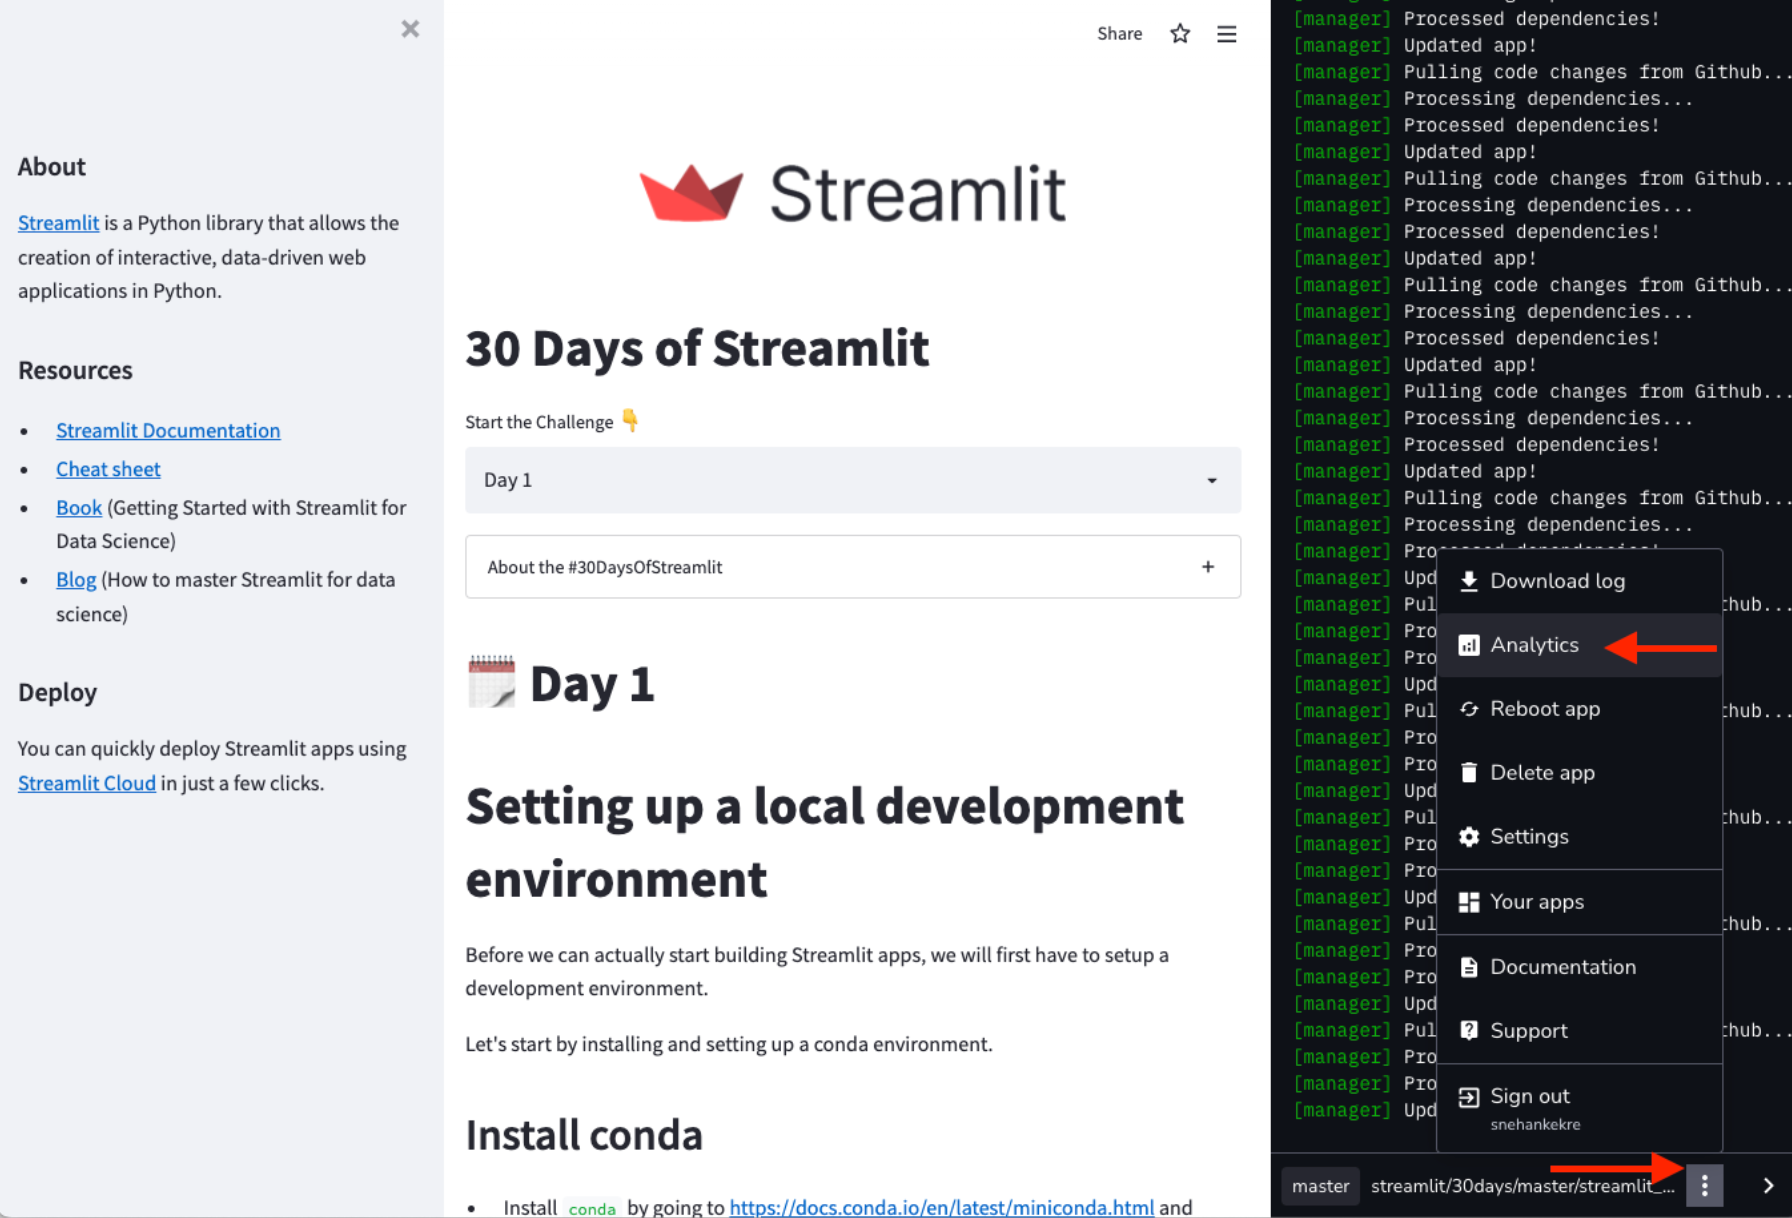
3. From your "Apps" page, click "Manage app" console, then select "Analytics":
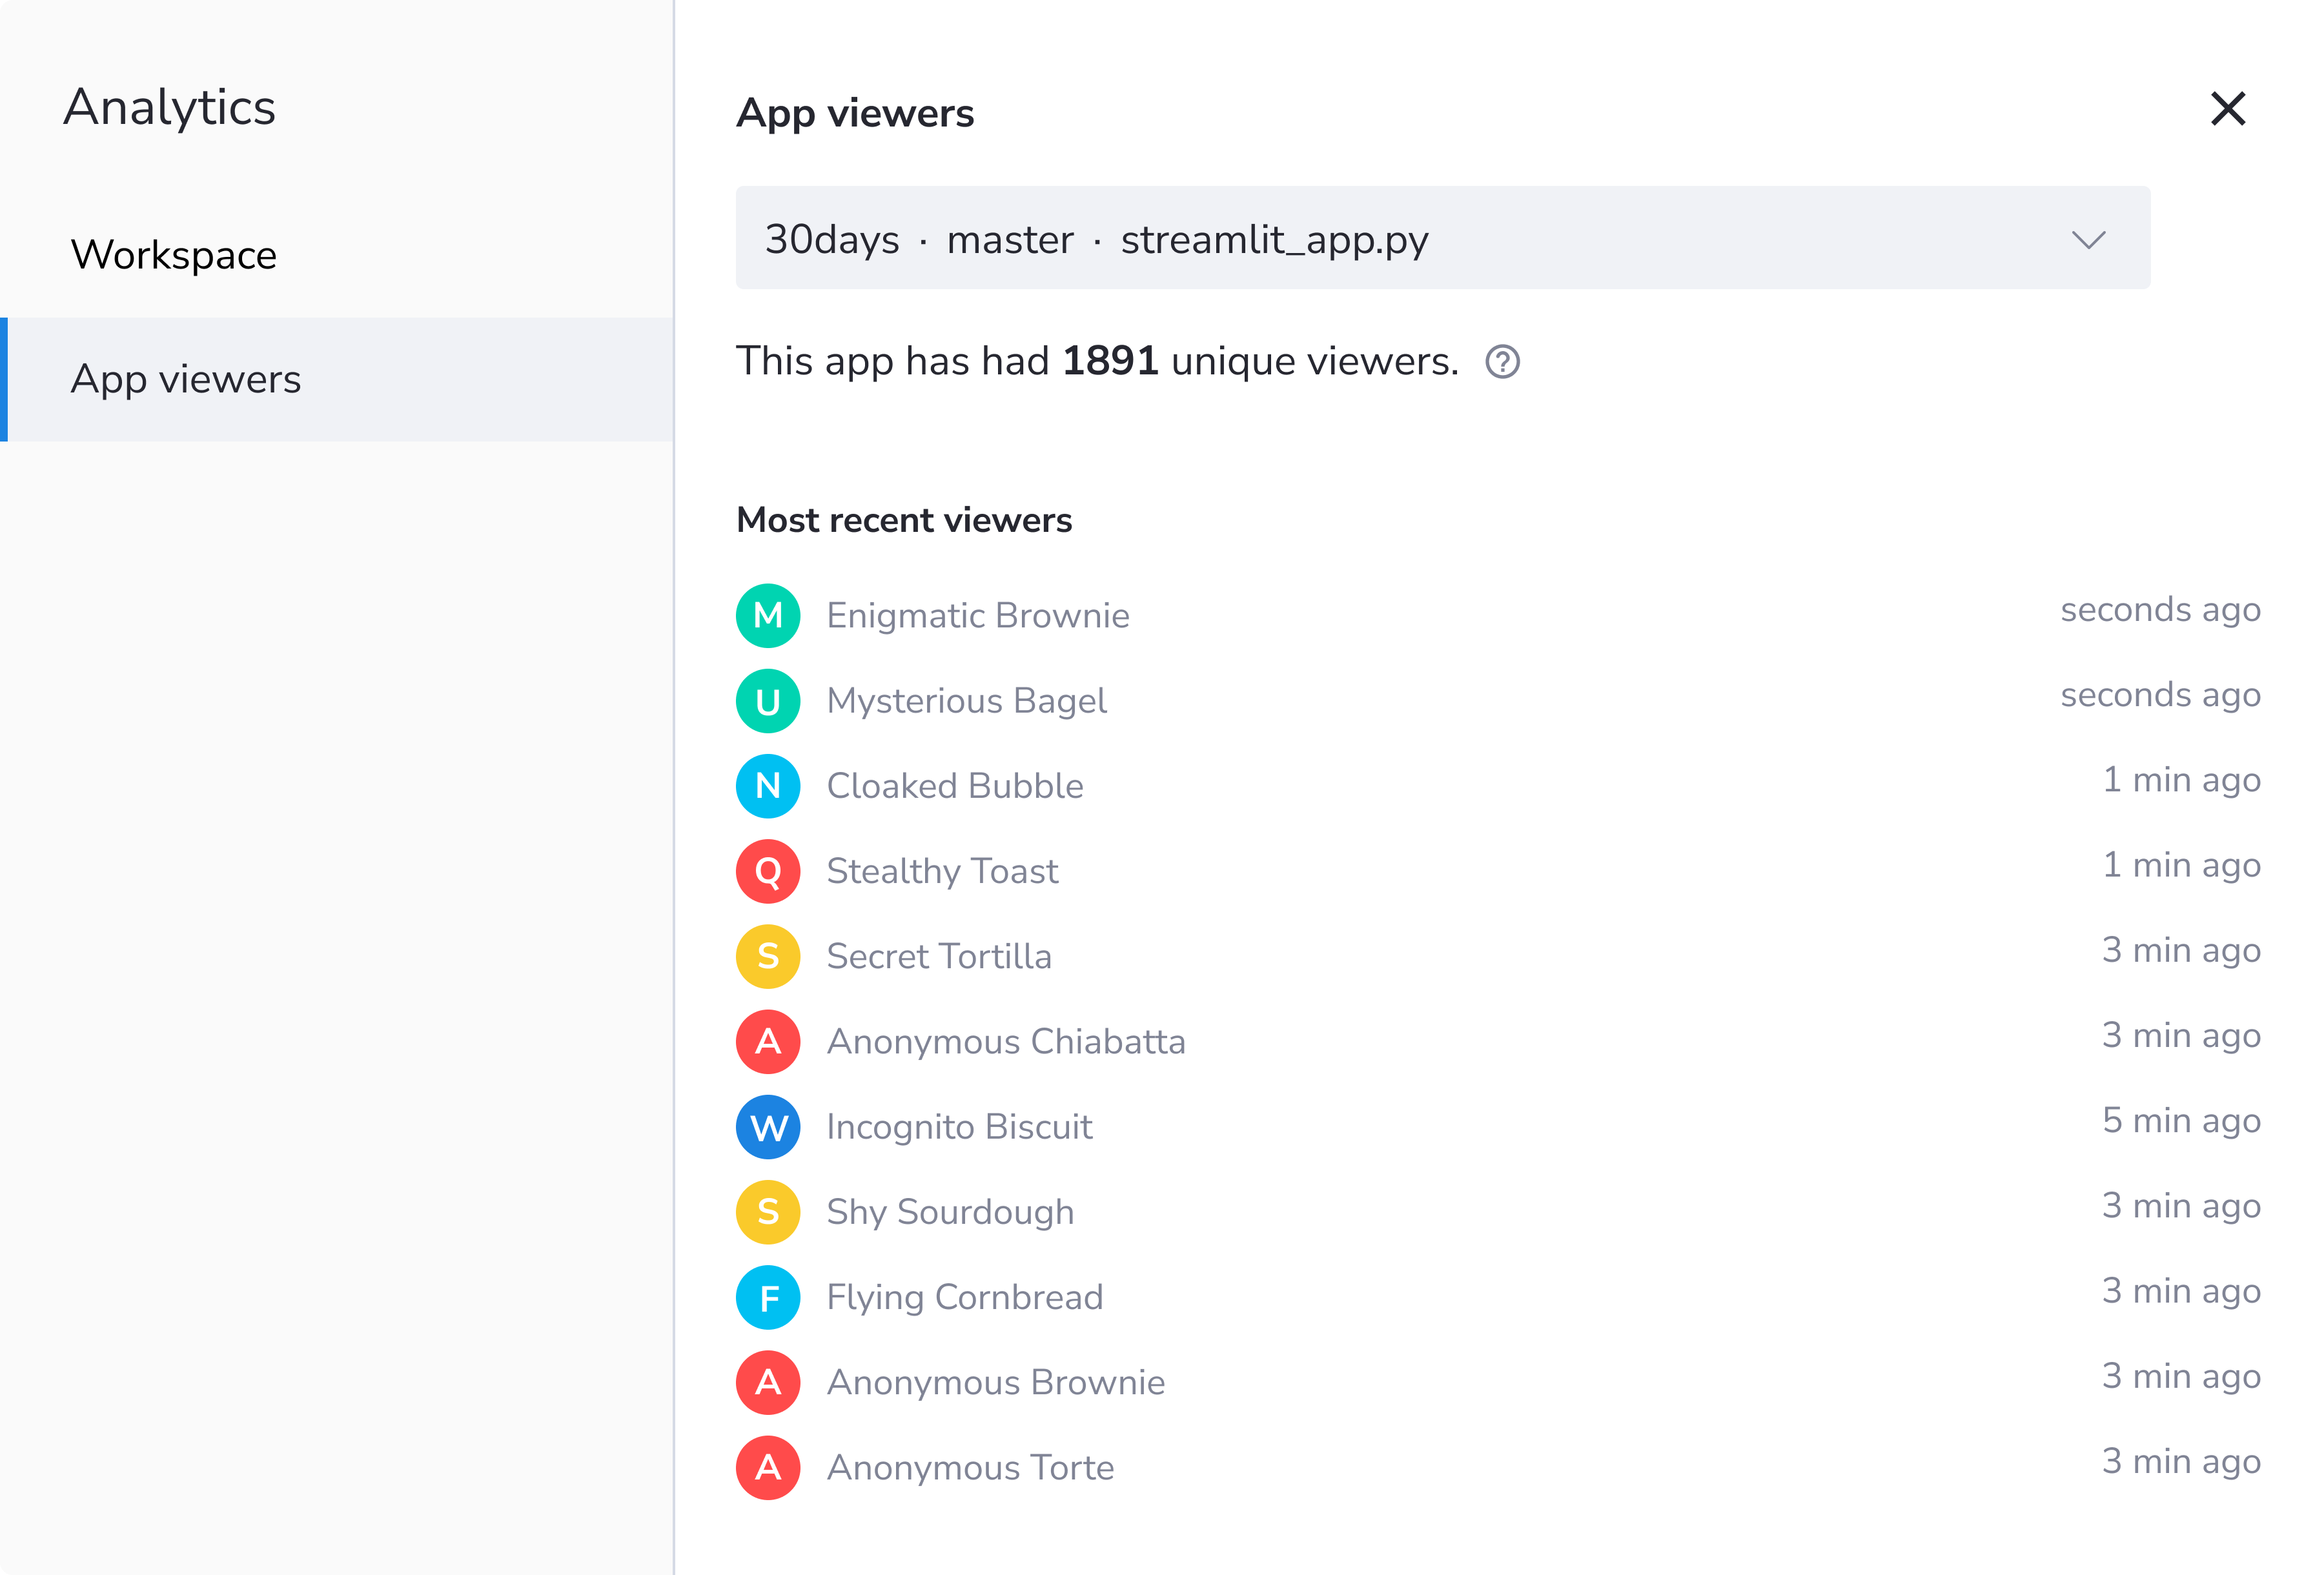
All three ways will bring you to the same feature:
- The total all-time number of unique app viewers (including April 2022 and onward).
- The list of the most recent viewer names (capped to 20) and the relative timestamp of their last view sorted by the time since the last view (newest first).
For public apps like 30 Days of Streamlit, we track individual usage but not identity, so we make up names for your public viewers. They're shown as random pseudonyms (for example, Enigmatic Brownie).
If you're building something awesome, but not quite ready for the world to see it, use your one private app to test it. You can invite up to three viewers to your workspace as collaborators. The identities of all invited viewers within your workspace will be visible within the Analytics Modal.
Wrapping up
And that’s a wrap! You can now view Workspace analytics and App viewers analytics within your Community Cloud accounts. Check out our docs for more info.
Don’t have a Community Cloud account? Create one for free here.
Questions? Suggestions? Or have a neat app or some analytics to show off? Join us on the Streamlit community forum. We can't wait to hear what you think. 🎈
Huge kudos to...
Will Schmitt, Benny Raethlein, Andreas Braendhaugen, Will Huang, Laura Wilby, Henrikh Kantuni, Zachary Blackwood, Grace Tan, Snehan Kekre, and James Thompson for bringing this feature to life on Community Cloud. And thanks to all the community members who gave feedback on the different iteration ideas for analytics in the past!


Comments
Continue the conversation in our forums →