Does your Streamlit app crash after long use or constantly runs out of memory? Chances are, it has a memory leak.
In this post, you’ll learn how to find and fix memory leaks in three simple steps:
- Identify the memory leak
- Identify the leaking objects
- Identify the code that's allocating the leaking objects
NOTE: Streamlit is used in a variety of settings, from short-lived research projects to live company dashboards. This post is primarily aimed at developers deploying Streamlit apps with very long uptimes. We at Streamlit strive to keep the Streamlit framework itself free of leaks. Developers with long-running apps also need to be mindful of memory usage over time. Even a tiny memory leak can compound. Eventually, even the beefiest machine will fall over if memory usage isn’t kept in check.
Let’s dive right in.
1. Identify the memory leak
A leak happens when your app acquires memory resources and never releases them. It just consumes more and more memory. Since it's a finite resource, eventually it gets exhausted, and the OS terminates your application.
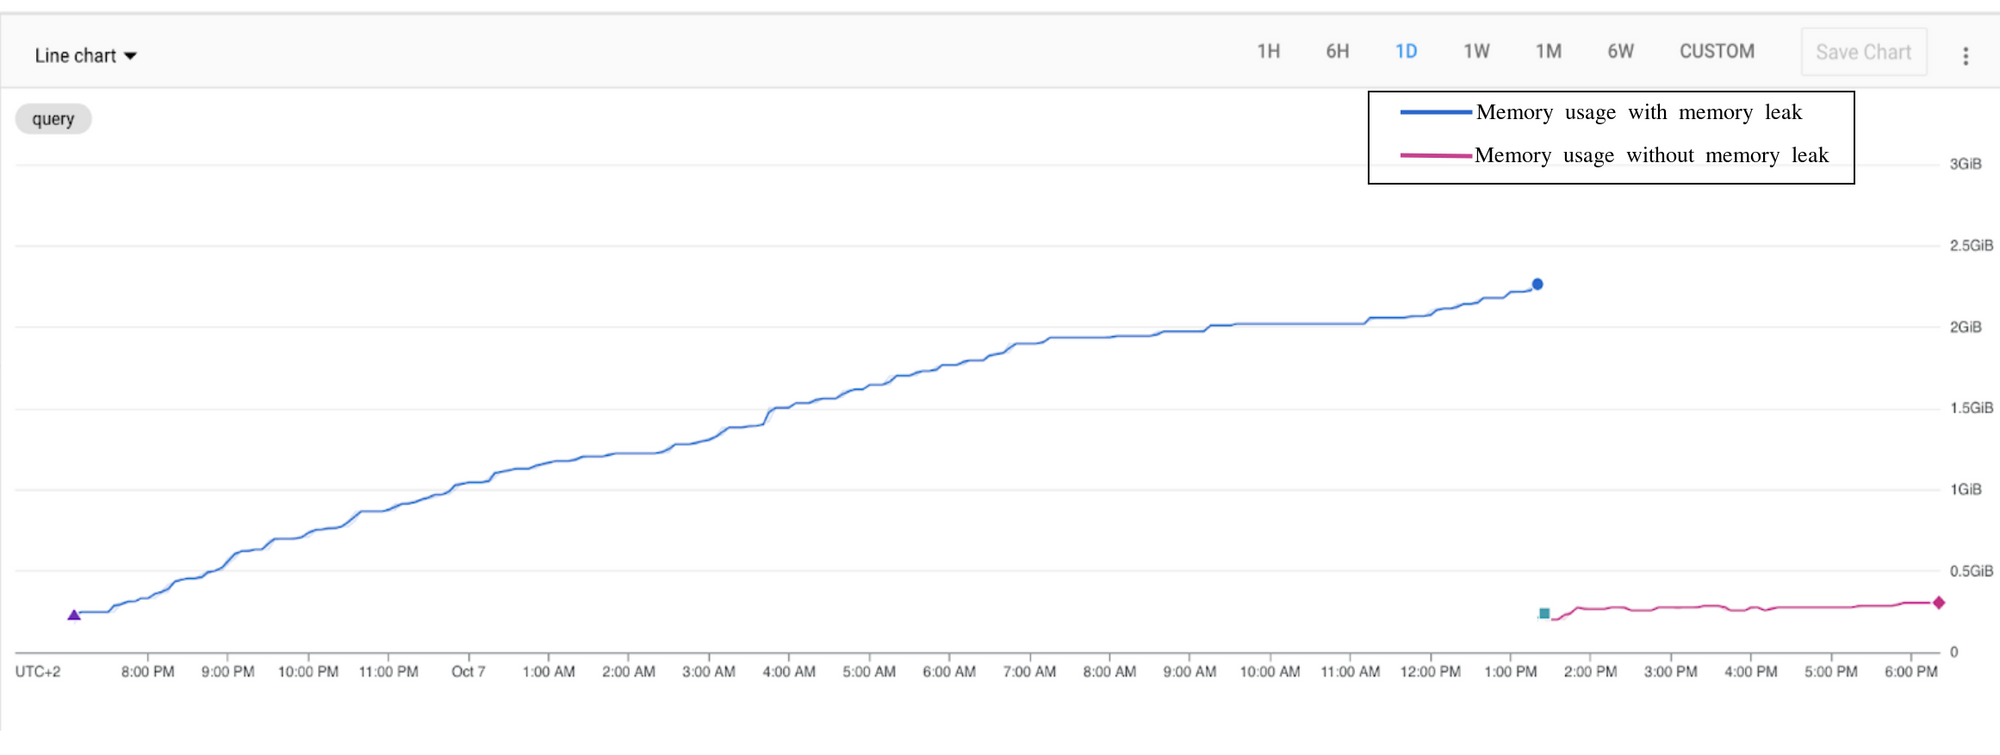
As an example, we'll use a Streamlit library memory leak that we investigated and patched as part of this pull request. After we found the faulty code and released a fix, apps started using one-tenth to one-twentieth of the memory used before!
To find out if your app leaks memory, use a memory profiler (we used mprof ):
# make sure mprof is installed
pip install memory_profiler

# find the pid of the Streamlit app (the next number after the user)
ps aux | grep "streamlit run" | grep -v grep

# start profiling the memory of the app
mprof run --attach <pid>
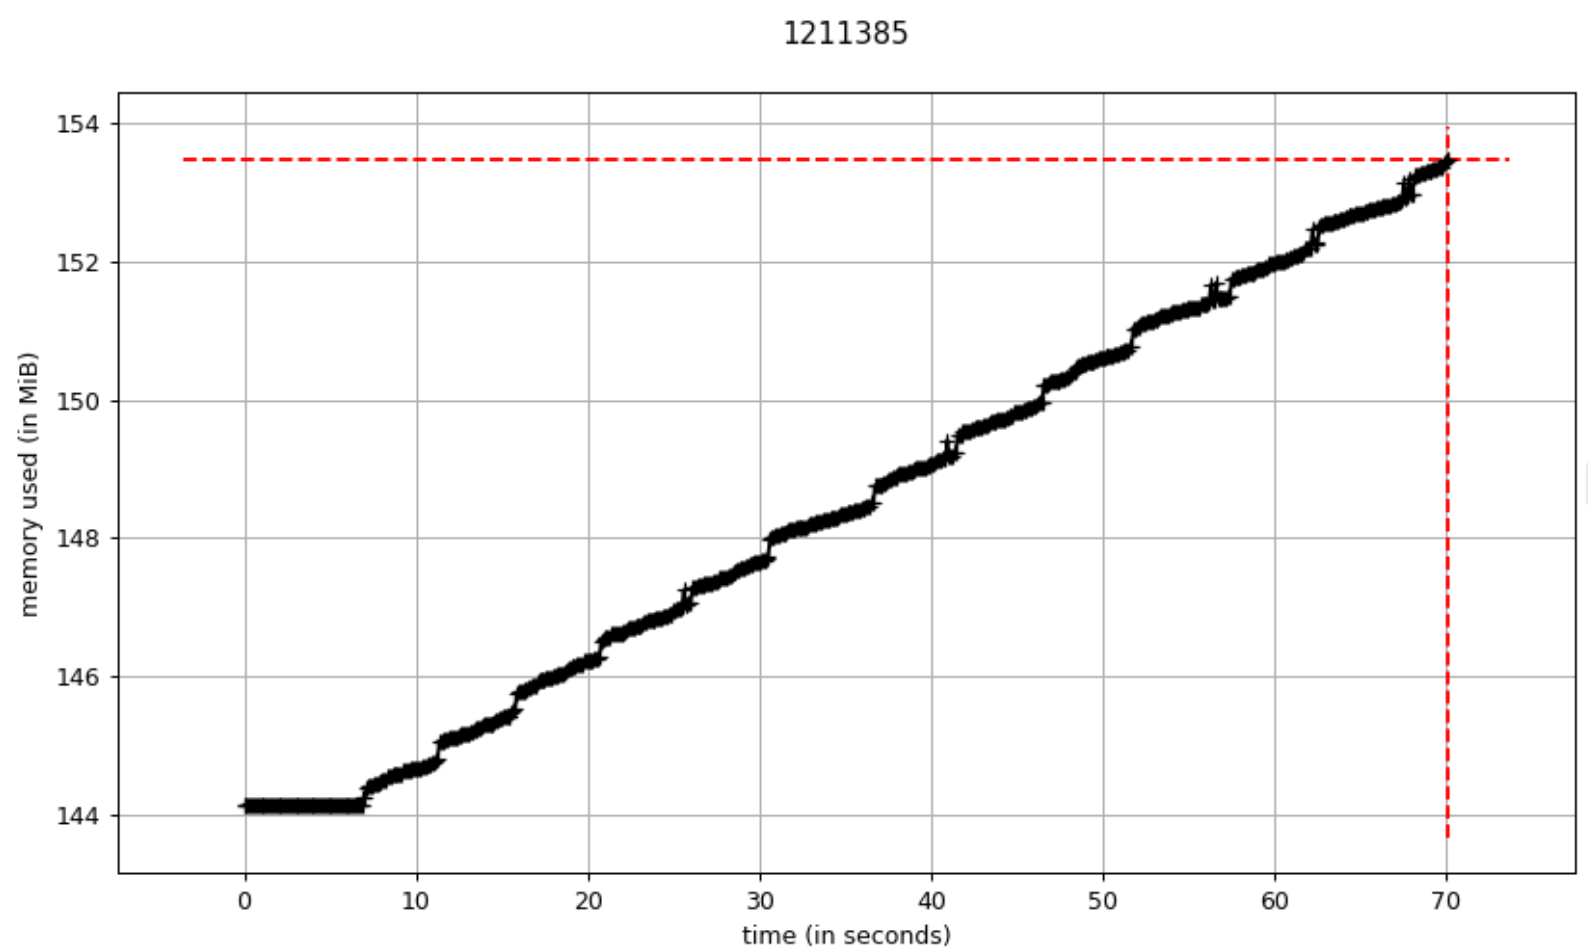
Once the profiler is attached, use your app to simulate a higher load (multiple sessions, more complex operations, etc.). After a few minutes, plot a memory graph:
mprof plot

# if the above gives you an error related to GUI you can try fixing it with
pip install PyQt5
If the memory usage doesn't plateau, your app is leaking memory:
2. Identify leaking objects
Now identify which objects are allocated and never released. Use the tracemalloc Python library. Take snapshots between executions (after forcing the garbage collection).
If an object persists in a snapshot, it means it's never collected:
import tracemalloc, json
import streamlit as st
import gc

@st.experimental_singleton
def init_tracking_object():
  tracemalloc.start(10)

  return {
    "runs": 0,
    "tracebacks": {}
  }


_TRACES = init_tracking_object()

def traceback_exclude_filter(patterns, tracebackList):
    """
    Returns False if any provided pattern exists in the filename of the traceback,
    Returns True otherwise.
    """
    for t in tracebackList:
        for p in patterns:
            if p in t.filename:
                return False
        return True


def traceback_include_filter(patterns, tracebackList):
    """
    Returns True if any provided pattern exists in the filename of the traceback,
    Returns False otherwise.
    """
    for t in tracebackList:
        for p in patterns:
            if p in t.filename:
                return True
    return False


def check_for_leaks(diff):
    """
    Checks if the same traceback appears consistently after multiple runs.

    diff - The object returned by tracemalloc#snapshot.compare_to
    """
    _TRACES["runs"] = _TRACES["runs"] + 1
    tracebacks = set()

    for sd in diff:
        for t in sd.traceback:
            tracebacks.add(t)

    if "tracebacks" not in _TRACES or len(_TRACES["tracebacks"]) == 0:
        for t in tracebacks:
            _TRACES["tracebacks"][t] = 1
    else:
        oldTracebacks = _TRACES["tracebacks"].keys()
        intersection = tracebacks.intersection(oldTracebacks)
        evictions = set()
        for t in _TRACES["tracebacks"]:
            if t not in intersection:
                evictions.add(t)
            else:
                _TRACES["tracebacks"][t] = _TRACES["tracebacks"][t] + 1

        for t in evictions:
            del _TRACES["tracebacks"][t]

    if _TRACES["runs"] > 1:
        st.write(f'After {_TRACES["runs"]} runs the following traces were collected.')
        prettyPrint = {}
        for t in _TRACES["tracebacks"]:
            prettyPrint[str(t)] = _TRACES["tracebacks"][t]
        st.write(json.dumps(prettyPrint, sort_keys=True, indent=4))


def compare_snapshots():
    """
    Compares two consecutive snapshots and tracks if the same traceback can be found
    in the diff. If a traceback consistently appears during runs, it's a good indicator
    for a memory leak.
    """
    snapshot = tracemalloc.take_snapshot()
    if "snapshot" in _TRACES:
        diff = snapshot.compare_to(_TRACES["snapshot"], "lineno")
        diff = [d for d in diff if
                d.count_diff > 0 and traceback_exclude_filter(["tornado"], d.traceback)
                and traceback_include_filter(["streamlit"], d.traceback)
                ]
        check_for_leaks(diff)

    _TRACES["snapshot"] = snapshot


gc.collect()
compare_snapshots()
NOTE: Call compare_snapshots() always after the gc collection is forced, to make sure you track only the objects for which memory can’t be reclaimed.
Run the above in the Streamlit app, version lower than 1.0, and you'll get the following output:
"<attrs generated init streamlit.state.session_state.SessionState>:17": 22,
SessionState is the object that leaked.
Now let's identify the part of the code that allocates the SessionState and never releases it.
3. Identify the code that's allocating the leaking objects
Track which object is not releasing the memory using the objgraph library. To install it, run pip install objgraph. Track the holder of the SessionState after the gc collection is forced:
import gc
import objgraph

for o in gc.get_objects():
    if 'session_state.SessionState' in str(type(o)) and o is not st.session_state:
        filename = f'/tmp/session_state_{hex(id(o))}.png'
        objgraph.show_chain(
            objgraph.find_backref_chain(
                 o,
                 objgraph.is_proper_module),
            backrefs=False,
            filename=filename)

        st.write("SessionState reference retained by: ", type(o))
        st.image(filename)
In our case, when we run on Streamlit versions below 1.0.0, you can see that the SessionState object is held by the Signal class:
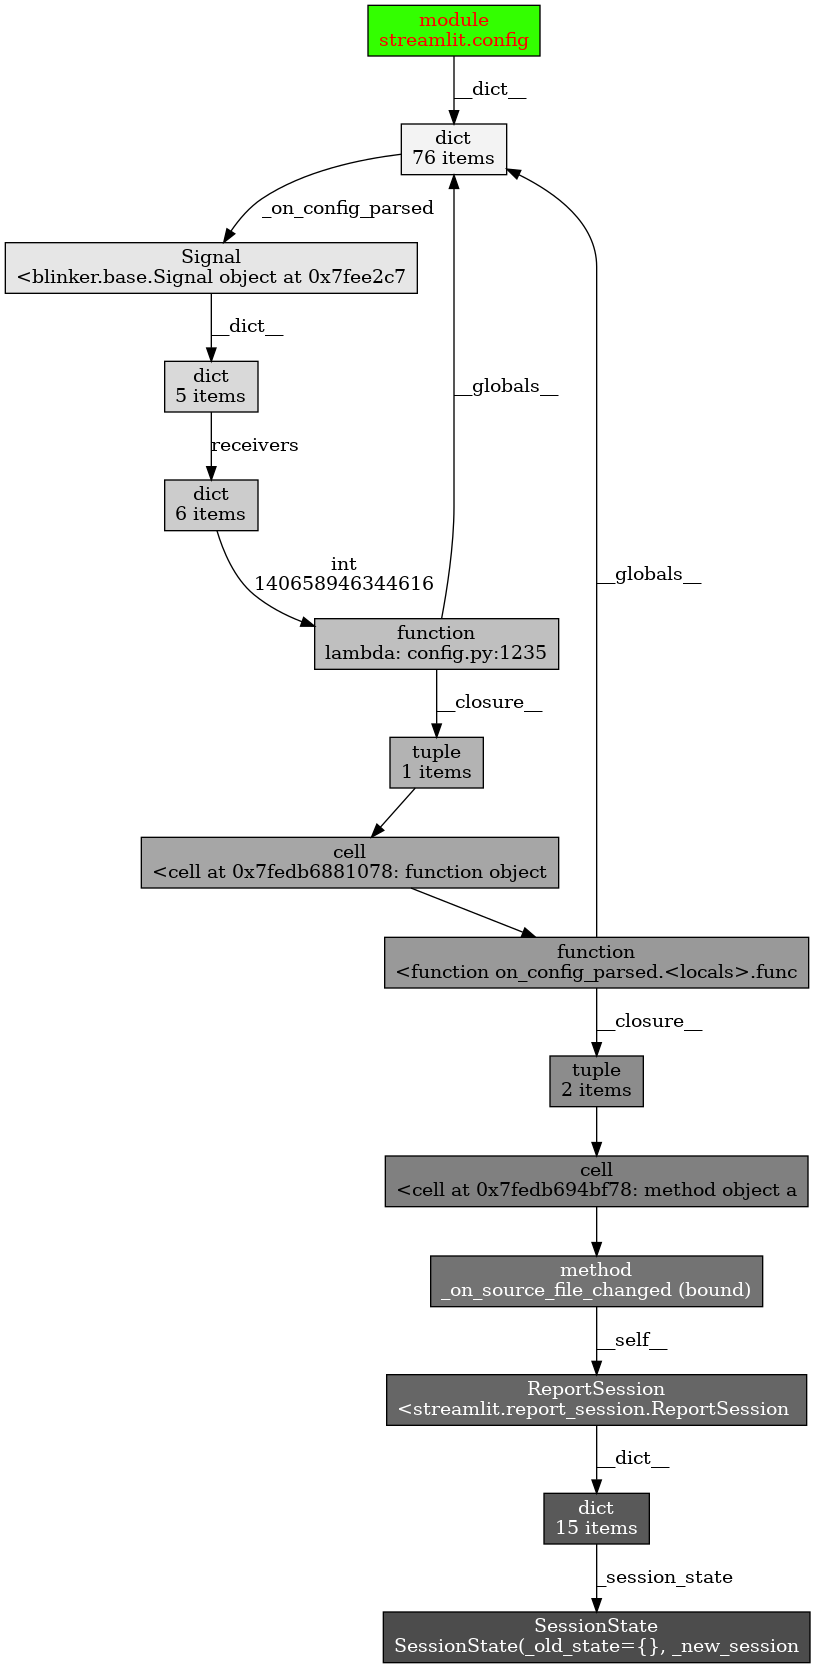
The allocation of SessionState happens in the streamlit.config module. The object holding the resource is Signal. It holds the resources that need to be released (check out our pull request).
After we applied the fix and updated the app, the memory usage plateaued:
Wrapping up
Now you know how to detect if your Streamlit app is leaking memory and how to fix it! If you have any questions, please let us know in the comments below or on the forum. We'd be happy to help! ❤️




Comments
Continue the conversation in our forums →