
Hey community, 👋
My name is Mark Needham, and I’m a Developer Advocate at StarTree. I work on Apache Pinot, a real-time distributed OLAP datastore. It’s purpose-built to deliver scalable real-time analytics with low latency (sometimes referred to as a way of querying Apache Kafka).
I love making demos of streaming data analytics. And I love running. So I built a real-time Streamlit dashboard on top of imaginary race data.
In this post, I’ll show you:
- How to create a data simulator using Python’s Twisted library
- How to ingest that data into Apache Kafka
- How to pull data from Apache Kafka into Apache Pinot
- How to query Apache Pinot to visualize the data in Streamlit
What's Park Run?
Before we delve into the details, let me give you some background on the data we'll be generating.
Park Run is an organization that hosts free weekly community events in the UK and some other countries. They include 5k runs on Saturday mornings and 2k runs on Sunday mornings. Each course has a page with information about it, directions, and a map.
Here is the Kingston course page:

By clicking through to the map, you can download the course in KML format. This lets you extract the latitude and longitude coordinates that make up the route, and the start and finish locations. With this data, you can create simulated runs based on the route coordinates.
Architecture diagram
Let's start with an architecture diagram that displays the app’s components:
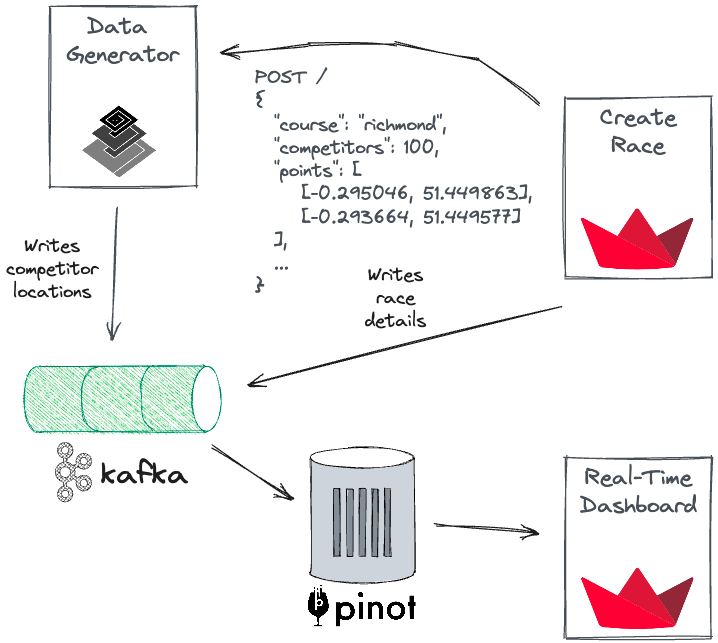
There are five components:
- Create Race: A Streamlit app that configures parameters for a new race.
- Data Generator: Processes new race requests, generates locations for each competitor, and publishes the events to a Kafka topic.
- Apache Kafka: Streaming data platform that acts as the source of truth for locations and races.
- Apache Pinot: Real-Time OLAP database that consumes data from Kafka.
- Real-Time Dashboard: A Streamlit app to show what’s happening in each race including a leadership and a live map.
Data generation
The data generation process begins with creating a race using the Streamlit app. It’s used to configure the parameters for a new race. You can choose the course, the number of competitors, the fastest and slowest potential pace, and the number of competitors that should get stuck in a geo-fenced part of the course.
Here is what it looks like:

After selecting the parameters, click on Generate race. This sends a POST request to the Data Generator. It has two components:
- An HTTP server that handles new race requests. Its resource generates all the locations (with associated timestamps) of a competitor for a race and writes them to an in-memory map.
- An event loop that runs every second and iterates over active competitors stored in the in-memory map. It extracts the competitor's latest location that occurred in the past and publishes the location to Kafka.
Querying data in Apache Kafka
kcat (previously known as Kafka cat) is an open-source command-line utility used for producing, consuming, and managing Apache Kafka messages. Use it to verify that your data has been successfully sent to Kafka.
The command below retrieves one record from the parkrun topic and pipes the output into jq, a command-line JSON processor:
kcat -C -b localhost:9092 -t parkrun -c1 | jq
{
  "runId": "637648ff-46fa-464b-9d80-acb647e7aa41",
  "eventId": "07803c75-cae5-4e69-8361-3bda41aa686f",
  "competitorId": 551870,
  "rawTime": 0,
  "timestamp": "2023-05-25 10:17:49",
  "lat": 51.45034,
  "lon": -0.29499,
  "distance": 0,
  "course": "richmond"
}
Ingesting data into Apache Pinot
Next, we’ll transfer the data from Kafka to Pinot. Pinot stores it in tables that can contain any number of columns. To create a table, you need to provide a schema and table configuration.
Let's begin with the schema for the parkrun table:
{
  "schemaName": "parkrun",
  "primaryKeyColumns": ["competitorId"],
  "dimensionFieldSpecs": [
    {"name": "runId", "dataType": "STRING"},
    {"name": "eventId", "dataType": "STRING"},
    {"name": "competitorId", "dataType": "LONG"},
    {"name": "rawTime", "dataType": "INT"},
    {"name": "lat", "dataType": "DOUBLE"},
    {"name": "lon", "dataType": "DOUBLE"},
    {"name": "location", "dataType": "BYTES"},
    {"name": "course", "dataType": "STRING"}
  ],
  "metricFieldSpecs": [{"name": "distance", "dataType": "DOUBLE"}],
  "dateTimeFieldSpecs": [
    {
      "name": "timestamp",
      "dataType": "TIMESTAMP",
      "format": "1:MILLISECONDS:EPOCH",
      "granularity": "1:MILLISECONDS"
    }
  ]
}
The columns in the schema are categorized using a similar language to data warehousing.
There are three categories:
- Dimension columns: Used in slice and dice operations, such as when using the SQL
WHEREandGROUP BYclauses. - Metric columns: Represent quantitative data and are used in aggregations, such as when using the SQL
SUM,MIN,MAX,COUNT, andAVGfunctions. You can also filter them. - DateTime columns: Represent time columns in the data. There can be many of them in a table, but only one can be treated as primary. They can also be used with the
WHEREorGROUP BYclauses.
Apache Pinot aligns and ingests data from the source (in this case, Kafka messages) based on matching property names with its column names. In other words, if a Kafka event includes a property labeled “foo,” and there exists a corresponding ”foo” column in the Pinot schema, Pinot will automatically ingest the value of “foo” from the Kafka event into its “foo” column.
The only field that doesn't have a corresponding source property is location. Let’s populate that using a transformation function:
{
  "tableName": "parkrun",
  "tableType": "REALTIME",
  "segmentsConfig": {
    "timeColumnName": "timestamp",
    "schemaName": "parkrun",
    "replication": "1",
    "replicasPerPartition": "1"
  },
  "tenants": {"broker": "DefaultTenant", "server": "DefaultTenant"},
  "tableIndexConfig": {
    "loadMode": "MMAP",
    "streamConfigs": {
      "streamType": "kafka",
      "stream.kafka.topic.name": "parkrun",
      "stream.kafka.broker.list": "kafka-run:9093",
      "stream.kafka.consumer.type": "lowlevel",
      "stream.kafka.consumer.prop.auto.offset.reset": "smallest",
      "stream.kafka.consumer.factory.class.name": "org.apache.pinot.plugin.stream.kafka20.KafkaConsumerFactory",
      "stream.kafka.decoder.class.name": "org.apache.pinot.plugin.stream.kafka.KafkaJSONMessageDecoder",
    },
  },
  "upsertConfig": {"mode": "FULL"},
  "routing": {"instanceSelectorType": "strictReplicaGroup"},
  "ingestionConfig": {
    "batchIngestionConfig": {
      "segmentIngestionType": "APPEND",
      "segmentIngestionFrequency": "DAILY"
    },
    "transformConfigs": [
      {
        "columnName": "location",
        "transformFunction": "toSphericalGeography(stPoint(lon, lat))"
      }
    ]
  },
  "metadata": {}
}
This table has a tableType of REALTIME, which means Pinot expects to see configuration for the streaming data platform under tableIndexConfig.streamConfigs. Set your streamType to kafka and then specify a couple of configuration parameters to indicate how messages should be decoded.
Define the following parameters:
stream.kafka.broker.listindicates where the Kafka broker is running[stream.kafka.topic.name](<http://stream.kafka.topic.name>)is the name of your topicstream.kafka.consumer.typeindicates how Kafka partitions should be consumed—lowlevelmeans that Pinot should consume them in parallelstream.kafka.consumer.prop.auto.offset.resetspecifies where consumption of the Kafka topic should begin—smallestmeans to start from the earliest available offset
Next, define a transformation configuration under ingestionConfig.transformConfigs to populate the location column. This function creates a geography object to represent the latitude/longitude location.
This table is also using Pinot’s upsert functionality (upsertConfig.mode). When you query the table, by default, you only get the most recent record for a given primary key. You’ll use this functionality because, for the majority of queries, you want to see only the latest location of each competitor.
The two other tables also have schema and table configurations (learn more here):
raceskeeps track of all the racescourseshas the course information
Building the real-time dashboard
Let's take a look at the real-time dashboard Streamlit app:
- Create an
[app.py](<http://app.py>)file and runstreamlit run app.pyfrom the terminal. - Use pinotdb to query data from Apache Pinot (before querying, the user must select a race to follow).
- Populate a
selectboxwith data from a query against theracestable:
from pinotdb import connect
import pandas as pd
import streamlit as st

conn = connect(host='localhost', port=8099, path='/query/sql', scheme='http')
curs = conn.cursor()
curs.execute("""
select runId, course, ToDateTime(startTime, 'YYYY-MM-dd HH:mm:ss') AS startTime,
       lookup('courses','longName','shortName',course) as courseName
from races
order by startTime DESC
""")
df = pd.DataFrame(curs, columns=[item[0] for item in curs.description])
COURSES_MAP = {pair[0]: f"{pair[3]} at {pair[2]}" for pair in df.values.tolist()}

run_id = st.selectbox(
    'Select event:', df['runId'].astype(str),
    format_func=lambda x:COURSES_MAP[ x ]
)
The query retrieves the ten most recent races in descending order. To retrieve the full name of the course, you’ll perform an in-memory join using Pinot's lookup function.
Refresh the app for the dropdown menu to appear and select a race:

Next, view the leaderboard to see who is winning and how far they are from the finish line.
Add the following code to the app:
curs = conn.cursor()
curs.execute("""
select competitorId,
    distance AS distanceCovered,
    round(%(courseDistance)d - distance, 1) AS distanceToGo,
    ToDateTime(1000 / (distance / rawTime) * 1000, 'HH:mm:ss') AS pacePerKm,
    ToDateTime(rawTime * 1000, 'mm:ss') AS raceTime
from parkrun
WHERE runId = %(runId)s
ORDER BY distanceToGo, rawTime
limit 10
""", {"courseDistance": distance, "runId": run_id})
df = pd.DataFrame(curs, columns=[item[0] for item in curs.description])

st.header("Leaderboard")
styler = df.style.hide(axis='index')
st.write(styler.to_html(), unsafe_allow_html=True)
Here is the race-in-progress leaderboard:

Use the experimental_rerun function for the app to refresh automatically.
The code is located near the top of the app:
if not "sleep_time" in st.session_state:
    st.session_state.sleep_time = 2

if not "auto_refresh" in st.session_state:
    st.session_state.auto_refresh = True

auto_refresh = st.sidebar.checkbox('Auto Refresh?', st.session_state.auto_refresh)

if auto_refresh:
    number = st.sidebar.number_input('Refresh rate in seconds', value=st.session_state.sleep_time)
    st.session_state.sleep_time = number
This code is located at the end:
if auto_refresh:
    time.sleep(number)
    st.experimental_rerun()
You can find it in a sidebar:

The best feature of this app is the live map that displays the location of each competitor. here is how to do it:
- Create it using Python's Folium library and render it to Streamlit using the streamlit-folium package.
- Save the course map (a geo-fenced area) and the start and end points in Pinot using WKT format.
- Use the Shapely library to extract an array of x and y coordinates.
Here is the code for converting WKT to coordinates:
from shapely import wkt

start_wkt = "POINT (-0.063253 51.41917000000001)"
end_wkt = "POINT (-0.064283 51.419324)"

x_start, y_start = wkt.loads(start_wkt).coords.xy
x_end, y_end = wkt.loads(end_wkt).coords.xy
Next, create a Folium map and add these points to the map:
from streamlit_folium import st_folium

m = folium.Map()

folium.Marker(location=(y_start[0], x_start[0]),
  icon=folium.Icon(color="green", icon="flag"), popup="Start").add_to(m)
folium.Marker(location=(y_end[0], x_end[0]),
  icon=folium.Icon(color="red", icon="flag"), popup="Finish").add_to(m)
Then get the coordinates for the course map and geofenced area (I have hardcoded those locations):
# Example values (these are derived from the database)
x = [-0.064245, -0.064524, -0.065779, -0.065801, -0.065865, -0.06579, -0.065854, -0.065962, -0.065672, -0.065329, -0.064824, -0.064277, -0.063977, -0.063805, -0.063719, -0.063644, -0.063859, -0.063988, -0.064181, -0.065178, -0.065887, -0.066606, -0.067292, -0.068354, -0.06859, -0.06903, -0.068976, -0.067281, -0.066777, -0.066359, -0.06564, -0.065597, -0.065608, -0.06579, -0.065822, -0.066858, -0.068118, -0.068837, -0.069143, -0.069041, -0.06961, -0.070479, -0.070725, -0.070618, -0.070522, -0.0705, -0.070511, -0.07065, -0.071326, -0.071637, -0.071659, -0.071133, -0.071173, -0.071857, -0.072002, -0.072238, -0.073204, -0.074212, -0.074598, -0.074813, -0.075628, -0.075757, -0.075178, -0.073912, -0.073408, -0.072742, -0.071981, -0.071726, -0.071641, -0.071388, -0.071219, -0.070994, -0.070806, -0.070656, -0.070475, -0.070213, -0.069919, -0.069695, -0.069418, -0.069199, -0.068542, -0.067217, -0.066694, -0.066166, -0.066032, -0.065114, -0.064406, -0.064556, -0.065141, -0.065726, -0.063215]
y = [51.419386, 51.419459, 51.419754, 51.419673, 51.419513, 51.419366, 51.419178, 51.418984, 51.41879, 51.418757, 51.41877, 51.41877, 51.41873, 51.418777, 51.418676, 51.418496, 51.418288, 51.418061, 51.417967, 51.417606, 51.417271, 51.41695, 51.416964, 51.417017, 51.417245, 51.417592, 51.417706, 51.418583, 51.419285, 51.420088, 51.421523, 51.421998, 51.42245, 51.422925, 51.423045, 51.422878, 51.422731, 51.422838, 51.423223, 51.423601, 51.423955, 51.424136, 51.424029, 51.423902, 51.423721, 51.423607, 51.42342, 51.423306, 51.422664, 51.422677, 51.422771, 51.423681, 51.424216, 51.424335, 51.423654, 51.4233, 51.421768, 51.420255, 51.419626, 51.41954, 51.420021, 51.420188, 51.421078, 51.423099, 51.423942, 51.423962, 51.423668, 51.424373, 51.424553, 51.424676, 51.424928, 51.425092, 51.42526, 51.425281, 51.42532, 51.425337, 51.425293, 51.425186, 51.425009, 51.424812, 51.4245, 51.424397, 51.424232, 51.423997, 51.423134, 51.422836, 51.422607, 51.4219, 51.421269, 51.419867, 51.419232]
x_geo = [-0.0651347637176514, -0.0643622875213623, -0.0632894039154053, -0.0638902187347412, -0.0645339488983154, -0.0656068325042725, -0.0676238536834717, -0.0686323642730713, -0.0679242610931396, -0.0672805309295654, -0.0651347637176514]
y_geo = [51.41916166790023, 51.41886727626769, 51.41846583007674, 51.417997471730985, 51.41767630894881, 51.416900156242406, 51.41687339212095, 51.41715441461497, 51.41776998166006, 51.41878698731156, 51.41916166790023]


loc = [(point[1], point[0]) for point in zip(x_geo, y_geo)]
lat = sum([point[0] for point in loc]) / len(loc)
lon = sum([point[1] for point in loc]) / len(loc)
folium.PolyLine(loc, color='red', weight=2, opacity=0.8).add_to(m)

loc = [(point[1], point[0]) for point in zip(x, y)]
lat = sum([point[0] for point in loc]) / len(loc)
lon = sum([point[1] for point in loc]) / len(loc)
route = folium.PolyLine(loc, color='#808080', weight=2, opacity=0.8).add_to(m)

m.fit_bounds(route.get_bounds())
A DataFrame contains the latest locations for each competitor. Add it to a feature group so that only that portion of the map will be refreshed:
fg = folium.FeatureGroup(name="Competitors")

for lat, lon in zip(df_front.lat.values, df_front.lon.values):
    fg.add_child(
        folium.CircleMarker(location=(lat, lon), radius=3, color='Fuchsia')
    )

st_data = st_folium(m,
    feature_group_to_add=fg,
    height=400,
    width=700,
)
Here is a race in progress:

Wrapping up
Thank you for reading my post! I hope it has given you some ideas on the types of apps that you can build with Apache Kafka and Apache Pinot. If you have any questions, please post them in the comments below or contact me on LinkedIn.
Happy Streamlit-ing! 🎈


Comments
Continue the conversation in our forums →