I’m an SEO manager, and Google Search Console (let’s call it GSC) has been an essential piece of my SEO toolbox for years. And it appeals not only to us, SEOs. It's a ubiquitous tool for marketers and website owners.
But have you ever tried exporting complete data from the Google Search Console interface?
You can’t. It’s limited to 1,000 rows.
That’s why I created the Google Search Console Connector app — to get past this limit. And I’ve added a few goodies to take GSC exports to new heights!
In this post, I’ll show you how to use my app in five simple steps:
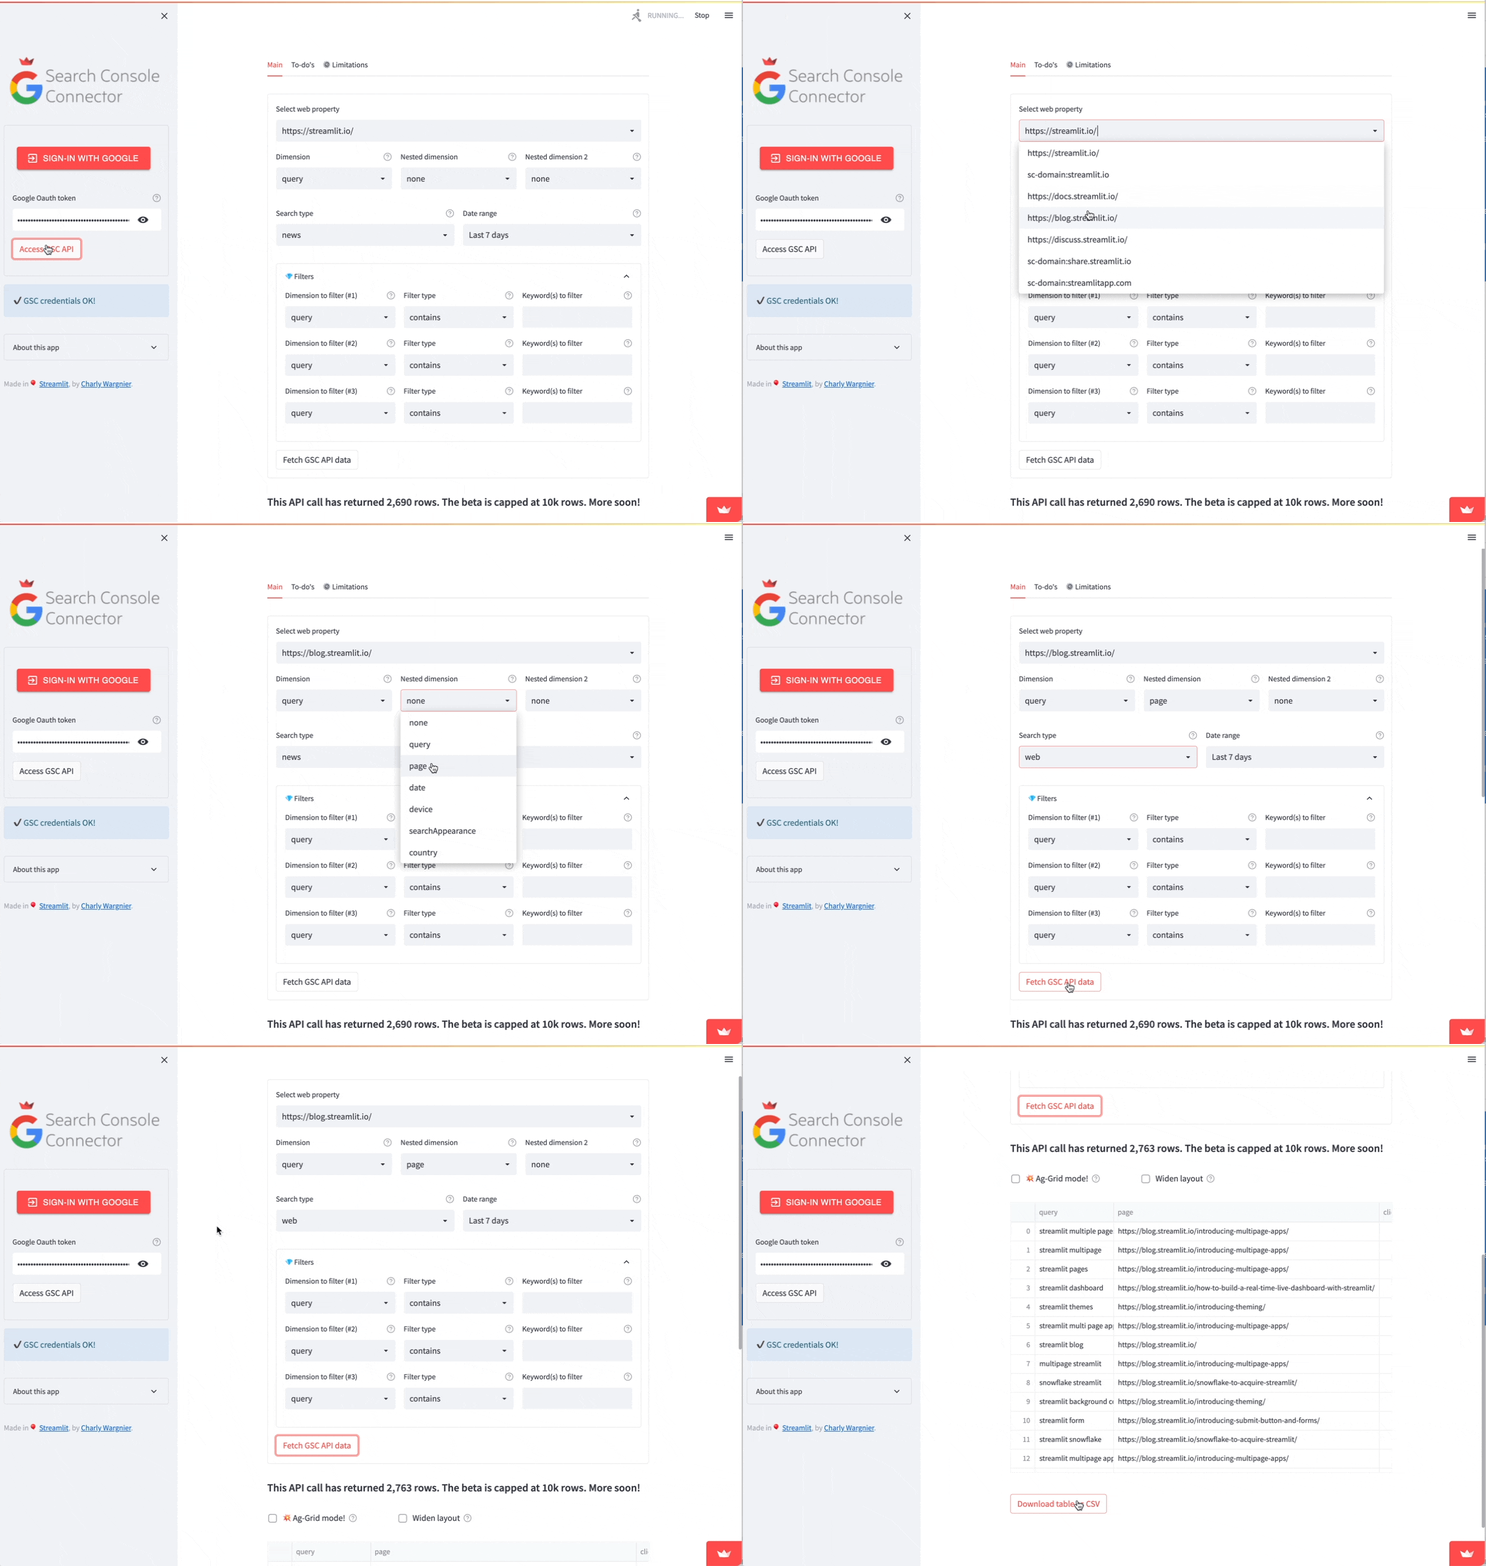
- Step 1. Connect to your Google Search Console account
- Step 2. Select your dimensions
- Step 3. Select search types and date ranges
- Step 4. Use the filtering section
- Step 5. View the results!
TLDR? Here is the app. Or go straight to the repo code! 🧑💻
But before we dive into it, let’s talk about...
What is Google Search Console?
Google Search Console (GSC) is an SEO tool to monitor, maintain, and troubleshoot the websites’ organic presence in Google's SERPs. It provides analytics on key SEO metrics like clicks, impressions, and the average site positions that we're all obsessing over.
But it has a few challenges:
- You can’t export more than 1,000 rows from the GSC interface. So if you're a publisher with thousands of search terms ranking in SERPs or your eCommerce website has thousands of product pages, you’re missing key insights.
- You can overcome this limit with the Google Search Console API, but using APIs requires extra skills (setting them up, querying them via SQL, Python, etc.).
- You can rely on third-party solutions from the Google ecosystem (Google BigQuery, Data Studio) or other Saas (PowerBI), but this requires more data engineering to work.
My Google Search Console Connector app lets you go beyond the dreaded 1k limit without any coding knowledge or API experience. I've relied on Josh Carty's Search Console wrapper to make it easy to authenticate via OAuth flow, traverse your account hierarchy, query and filter by various dimensions, and build complex queries.
Now, let's learn how to use it!
Step 1. Connect to your Google Search Console account
First, connect to your Google Search Console account (the authentication is done via OAuth).
- Press the
sign-in with Googlebutton. - Select your Google account.
- When redirected to Google's OAuth consent screen, press
continue. - Copy the Authorization code.
- Paste the code in the Google OAuth token and press
Access GSC API.
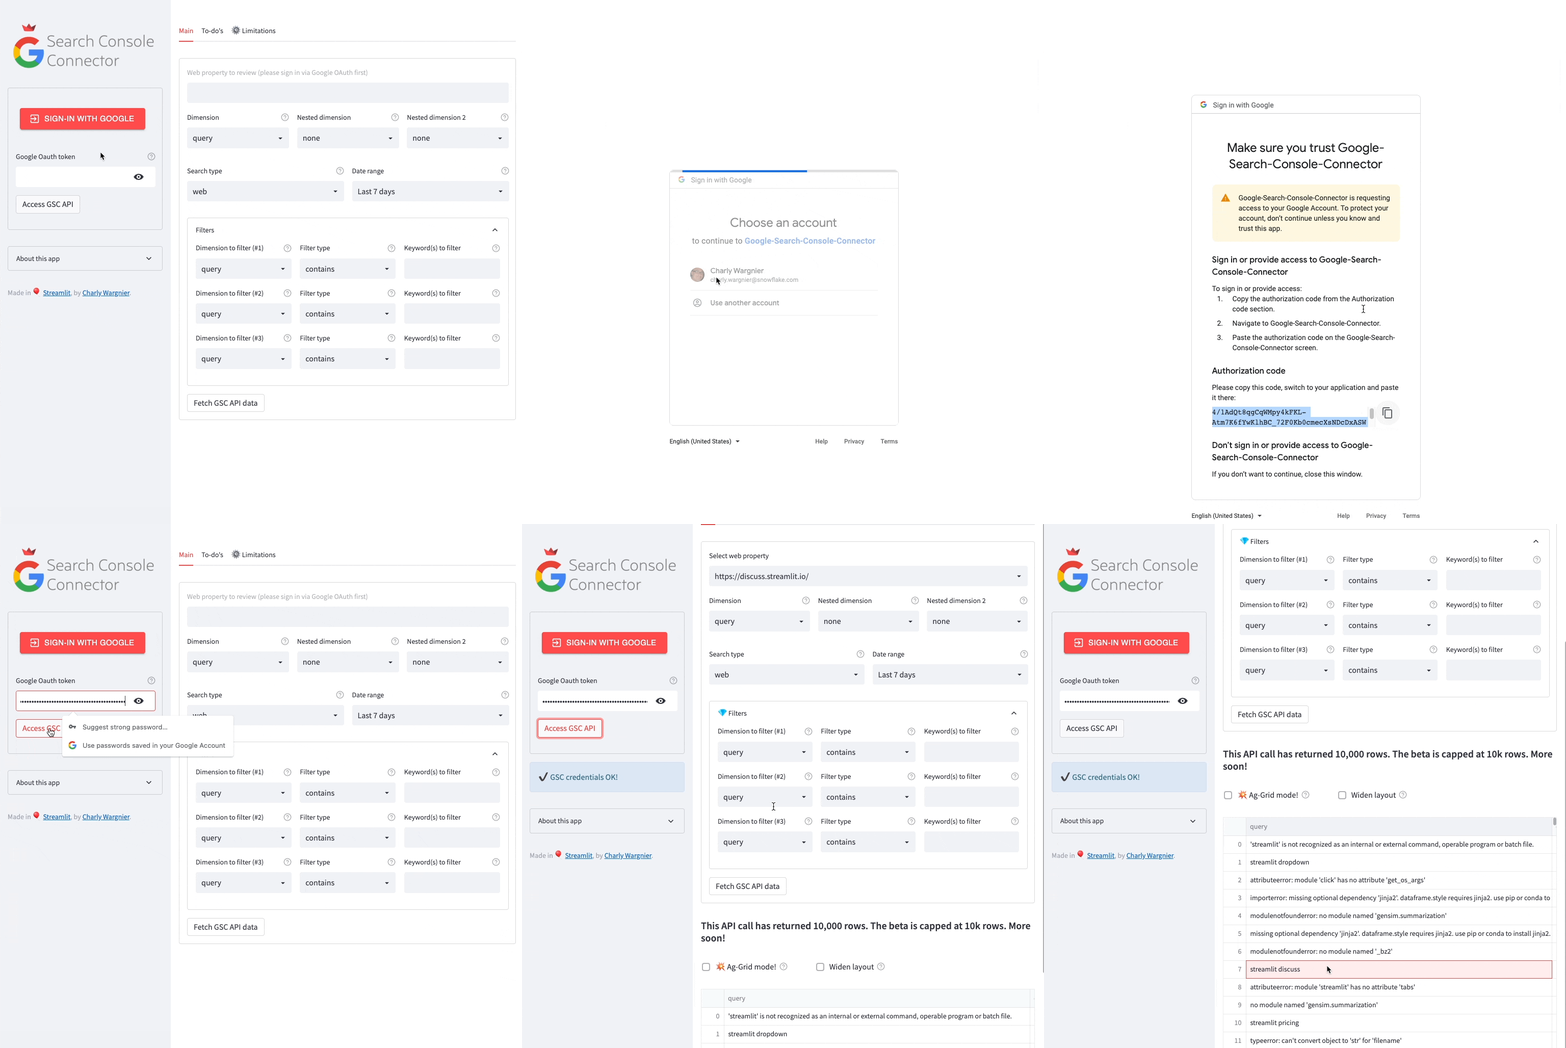
If the code is valid, you’ll be connected to your account and can select the web property of your choice:
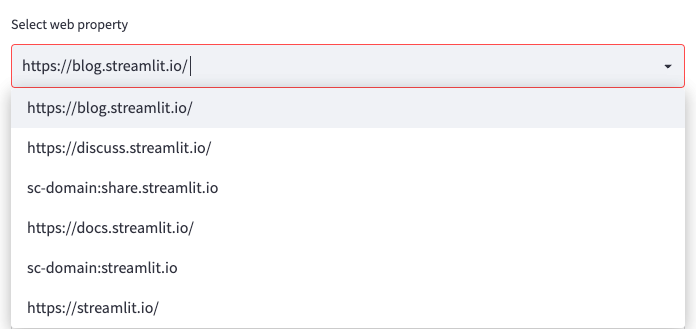
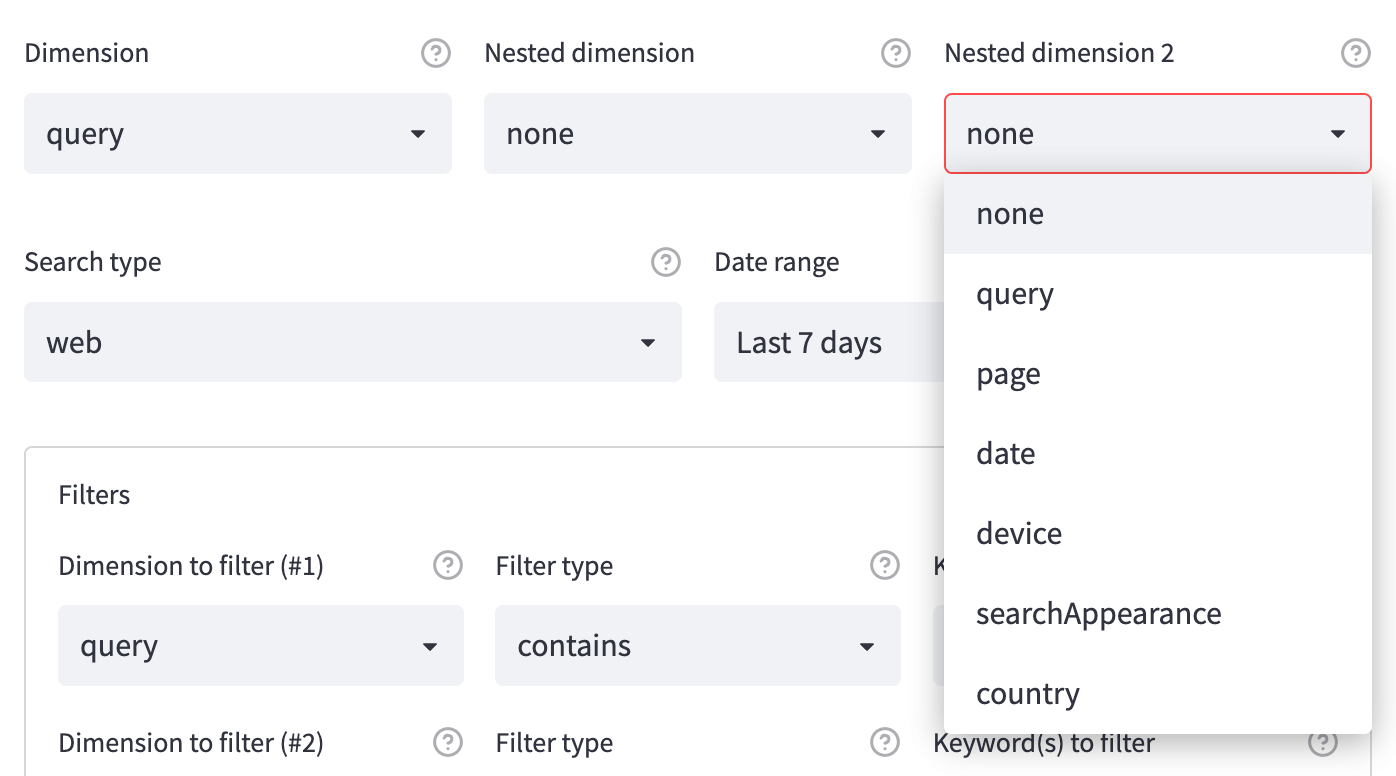
Step 2. Select your dimensions
Once you've selected your desired web property, you can segment your data in up to three dimensions:
Step 3. Select search types and date ranges
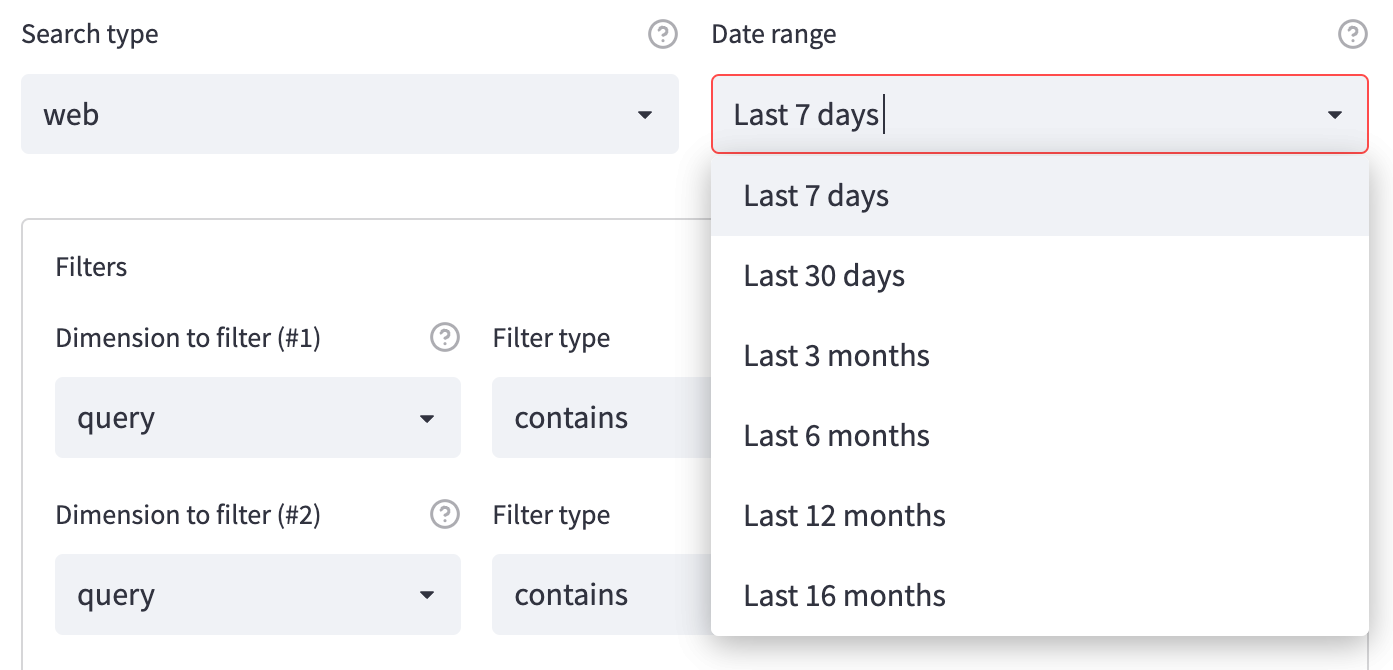
You can specify the search type data you want to retrieve by using the search_type method in your Python query:
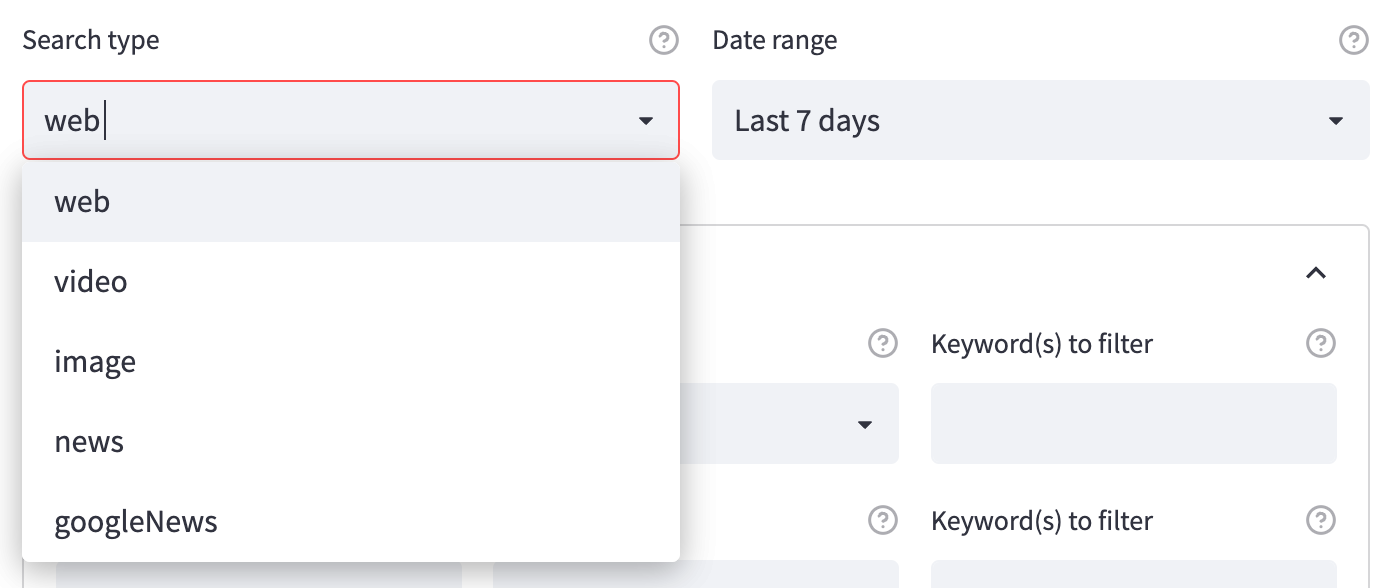
The default value is web to retrieve data from Google's classic SERPs. You can also choose to display search performance metrics for other search types supported by the GSC API: video, image, and news/googleNews. Handy for site owners who have this type of traffic! 🙌
You can also specify the date range. The following values currently supported by the API are also the ones available in my Streamlit app:
Step 4. Use the filtering section
Here you’ll find three filtering rows with three selectors in each: Dimension to filter, Filter type, Keywords to filter:
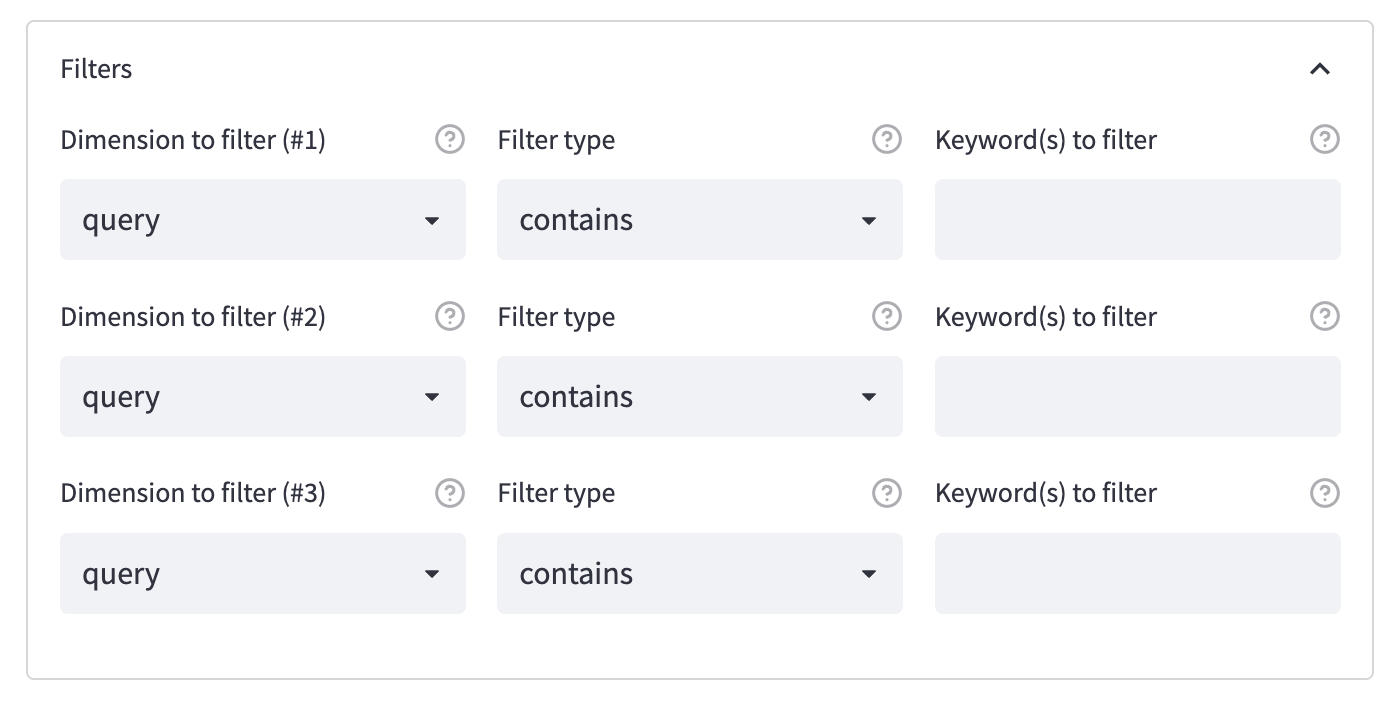
You can choose to filter dimensions and apply filters before executing a query. The filter types supported by the API are the same as those available in the UI: contains, equals, notContains, notEquals, includingRegex , and excludingRegex.
Finally, you can add the keywords you want to filter. Once happy with your selection, you can press the fetch the GSC API data button to start the API call (depending on the data you want, it might take a bit of time).
Step 5. View the results!
Now you can take a look at the results:
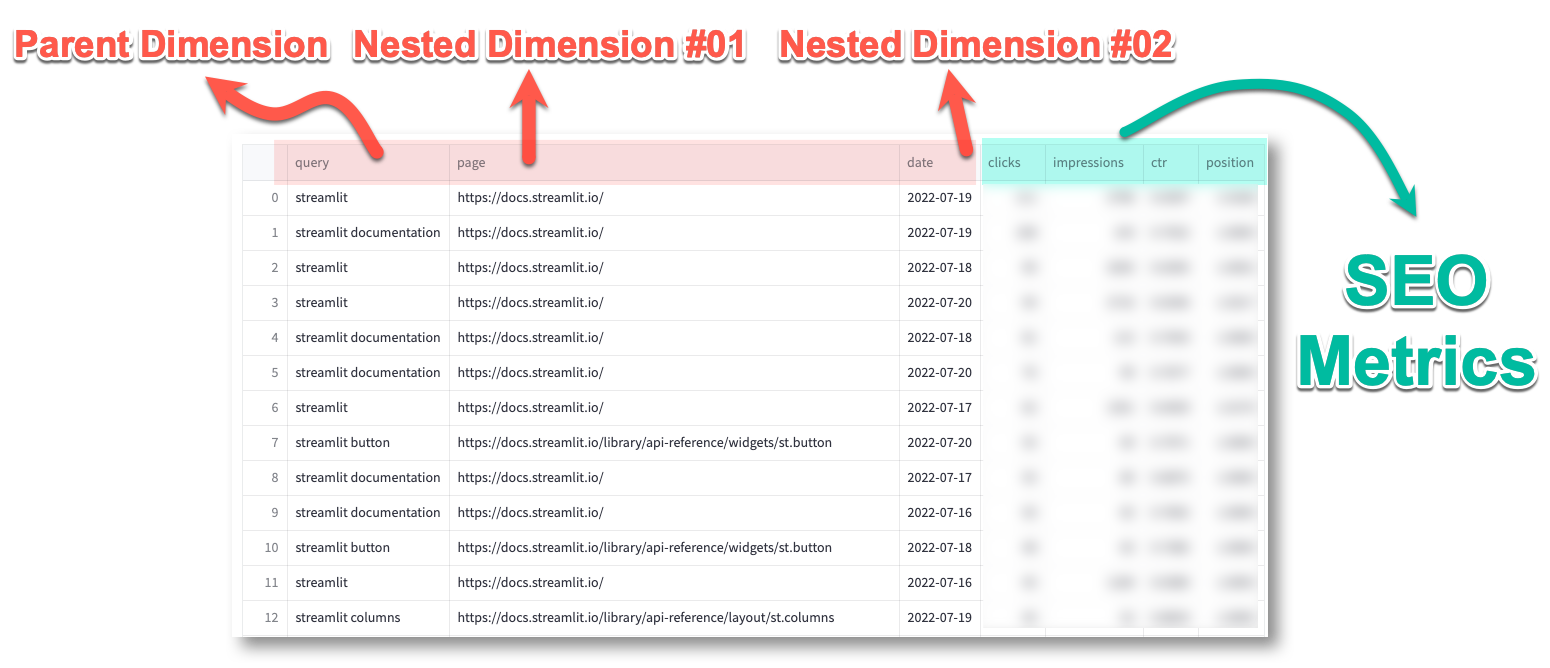
You’ll see all your nested dimensions—in this case, query, page, and date—followed by the default list of SEO metrics: clicks, impressions, ctr (click-through rates), and positions.
If you’re happy with your results, you can export them to CSV. Or you can refine them again!
If you want to bypass this limit, fork the repo and remove it from the code, as shown below:
RowCap = 10000 <- #replace 10,000 with your own limitExtra goodies
Want to add sorting, filtering, and pivoting options? Just switch to the fantastic Streamlit Ag-Grid—a port of the AG Grid framework in Streamlit designed by the one and only Pablo Fonseca:
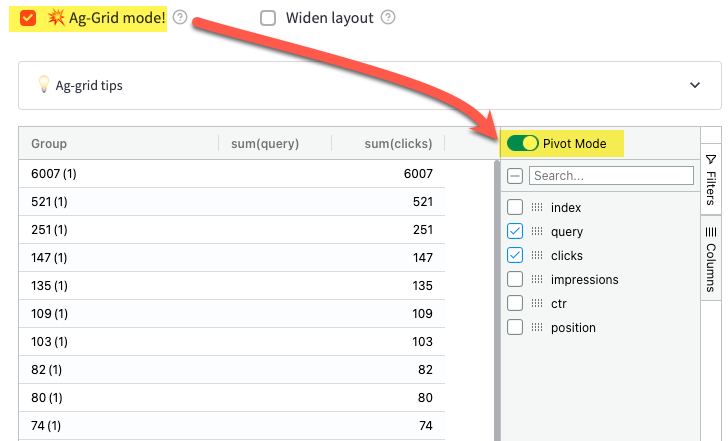
You'll also have the option to widen the app layout by clicking on Widen layout. This can be helpful for wide dataframes with many nested dimensions.
Wrapping up
To wrap up, I wanted to give you some creative ideas to broaden the app's possibilities:
- I'm open-sourcing the code, so you can fork the repo and expand the app to your liking—with more options, nested dimensions, charts, etc.
- Why not couple that GSC data with other APIs? Spice it up with the Google Ads API or the Google Analytics API to enrich your data landscapes!
- Copy the code for the Search Console Connector module (from the beginning of
streamlit_app.pytillthe submit_buttonvariable) and create your own app.
Want to take it a step further? I’ve only been scratching the surface by leveraging the Search Analytics module, but you can do even more:
- Retrieve XML sitemaps info for a given web property.
- Build an XML sitemaps checker in Streamlit.
- Inspect the page status in Google's indices (equivalent to the URL Inspection tool in Search Console). So why not build a dedicated indexation checker?
With Streamlit, the sky is the limit!
Happy Streamlit-ing! 🎈

Comments
Continue the conversation in our forums →