Have you ever done an amazing scientific analysis and wanted to share it? We wanted the same. That’s why we built Rascore, a Streamlit app for sharing study results with fellow researchers to make new discoveries.
In this post, you’ll learn:
- How to share an explorable scientific dataset
- How to visualize the 3D structure of human proteins
- How to make informative data plots
TLDR? Here is our app. Or jump straight into the repo code! 🧑💻
But before we get into the exciting stuff, let’s talk about...
What is Rascore?
Rascore is an app for analyzing the 3D structure of the tumor-associated RAS proteins (KRAS, NRAS, and HRAS—the most common cancer drivers). Rascore helps scientists explore and compare published structural models of RAS proteins in the Protein Data Bank (PDB), as well as simplify biological study and facilitate drug discovery.
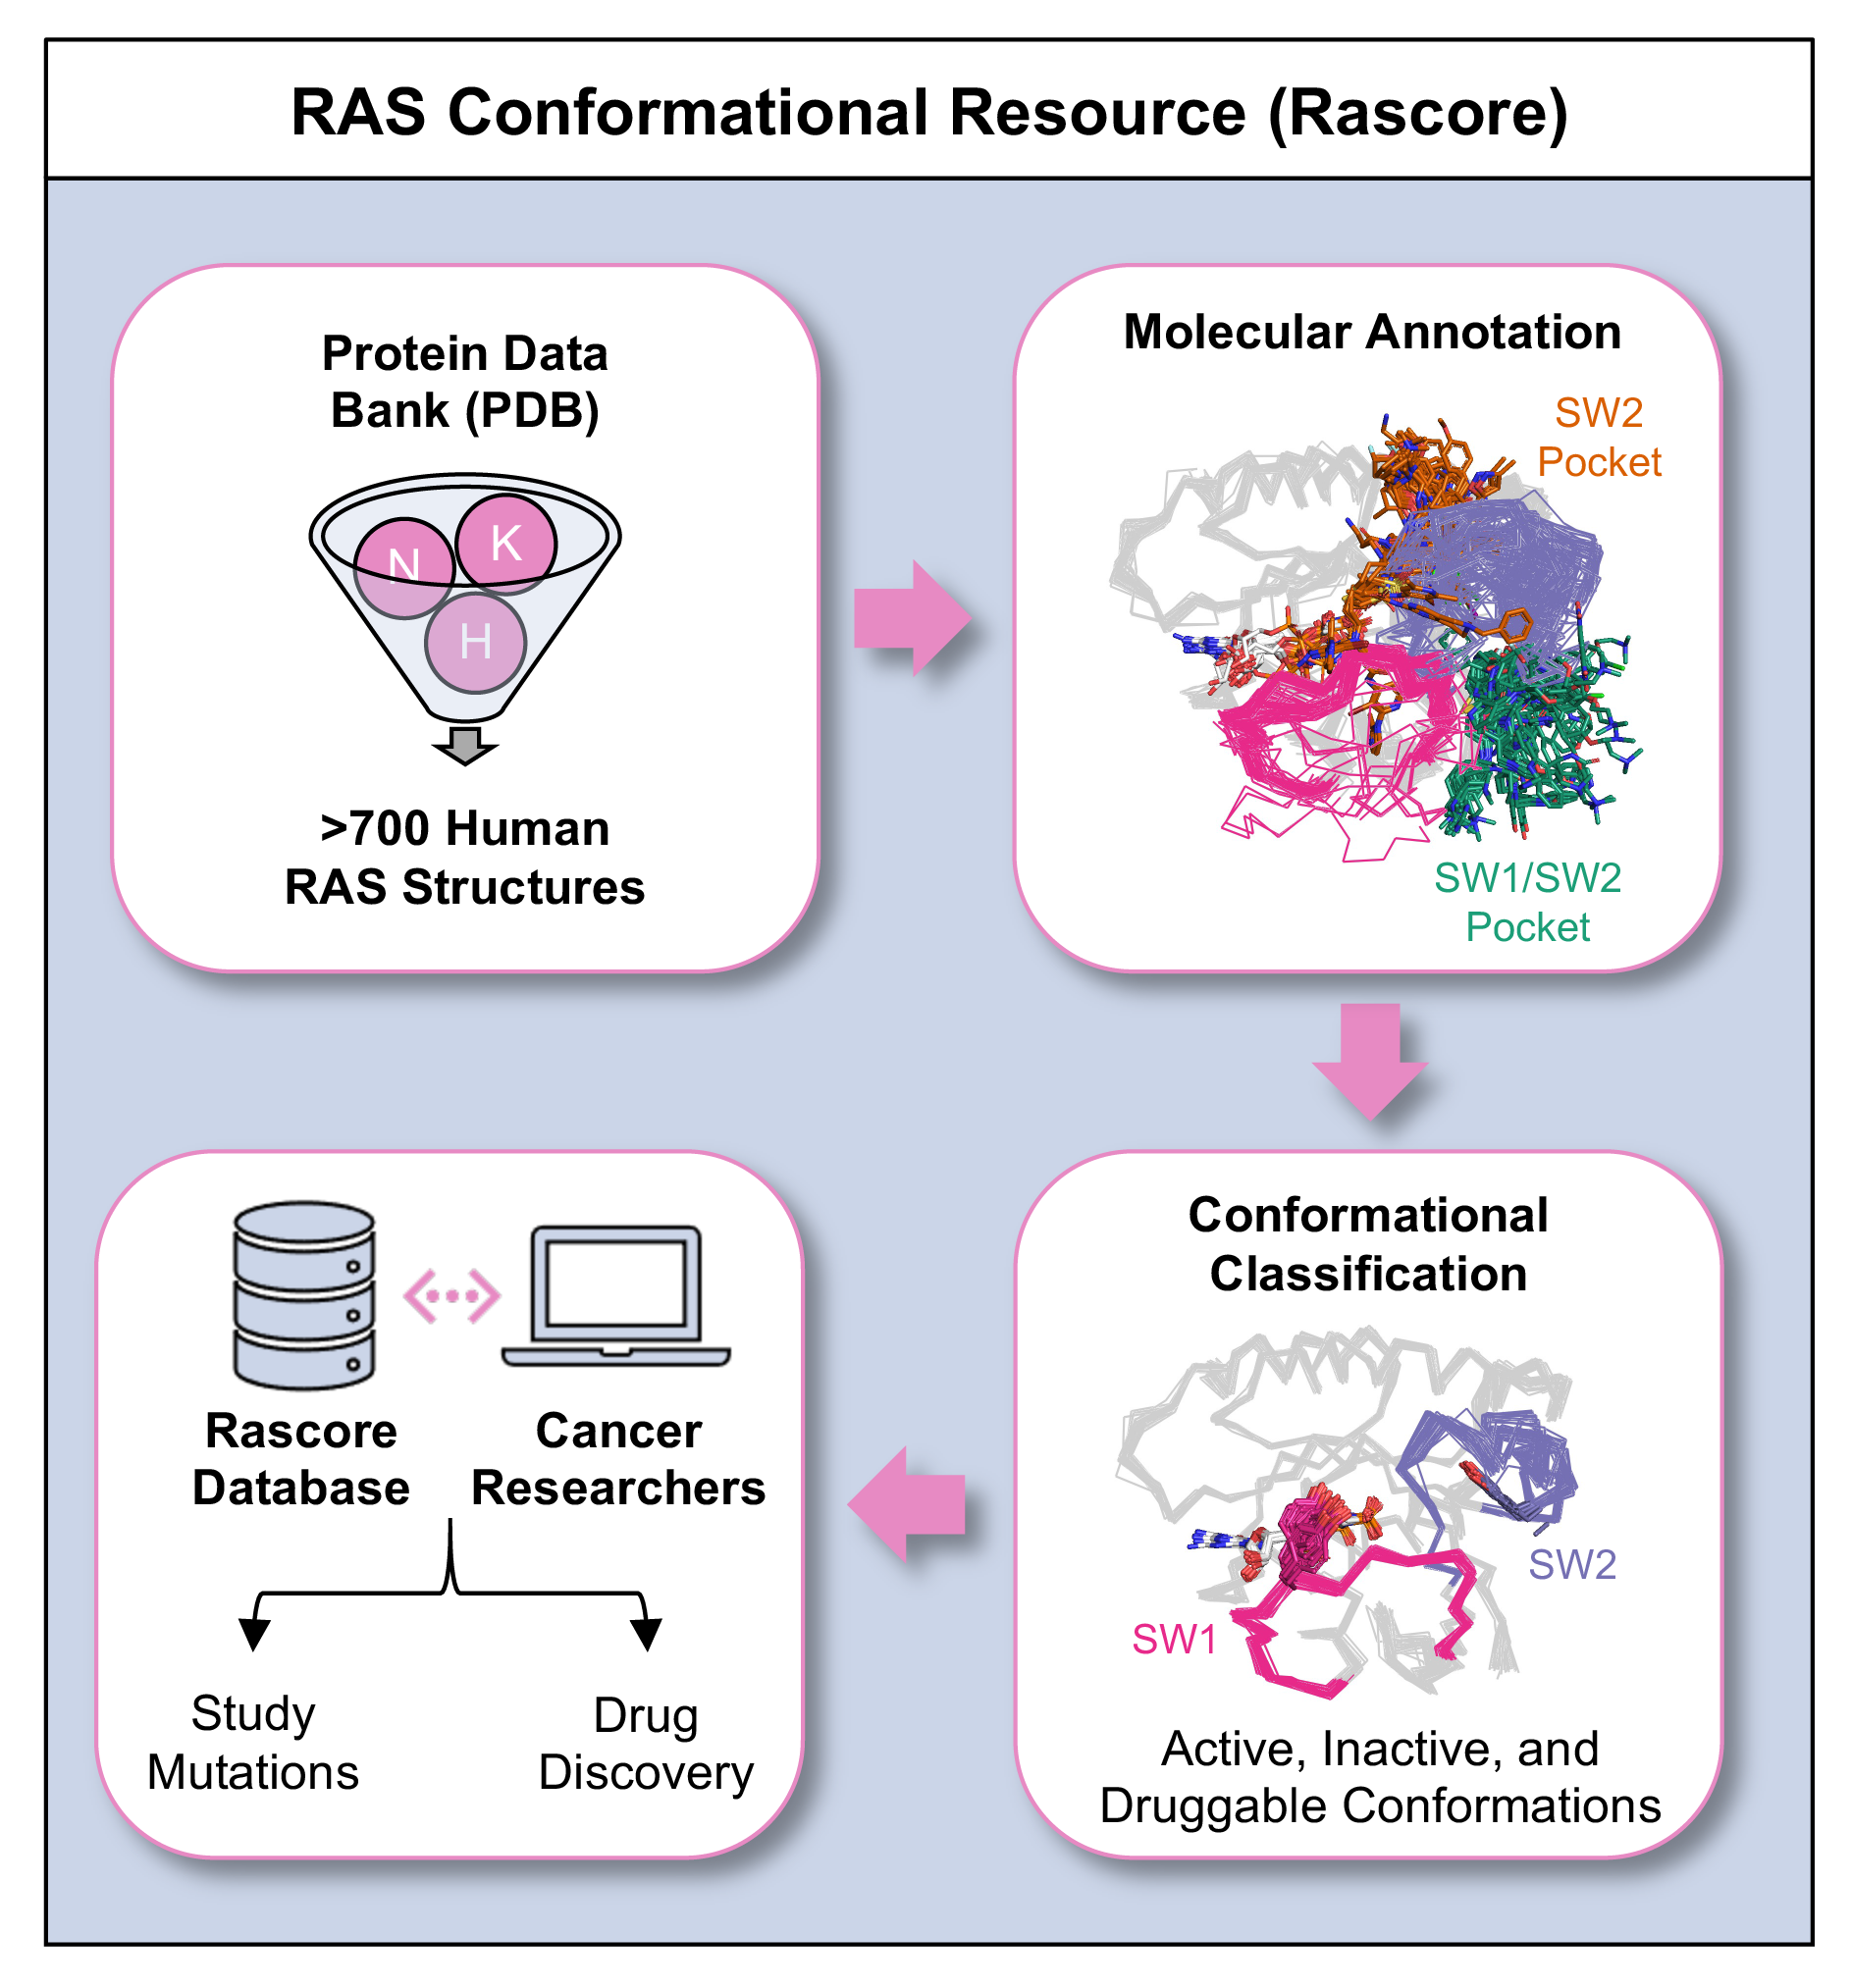
Almost all RAS structures are determined by X-ray crystallography. Because of the experiment conditions like mutation status or bound inhibitors, the structures come out differently. In Rascore, we group similar structures by their 3D configuration to examine their properties and how they’re correlated with conditions.
How to share an explorable scientific dataset
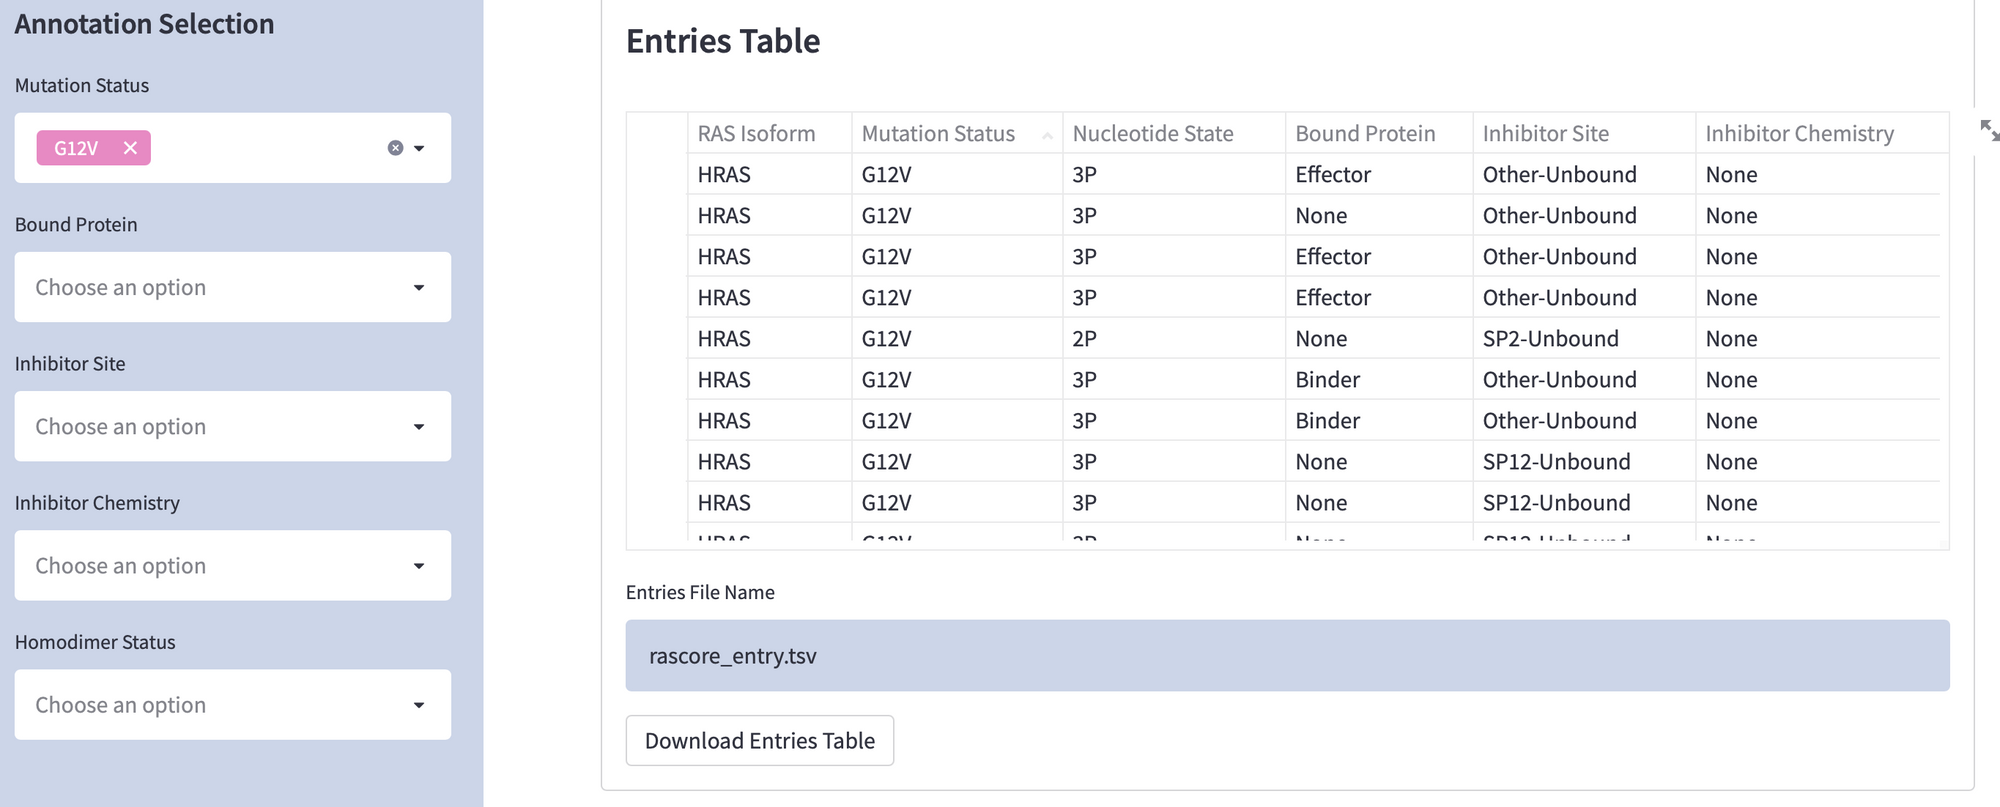
You can download all RAS protein structural models from the PDB, but they’re not annotated. We wanted to automate the annotation of each RAS structure by its biological features (read more in our paper “Delineating The RAS Conformational Landscape”).
We also wanted to let researchers explore our annotated dataset and download subsets—like all RAS structures with a specific mutation or bound drugs at a certain site.
Here is the code to display datasets as a table and download it (replace st.table with st.dataframe to make it scrollable):
Use this code to display a table:
import streamlit as st

def show_st_table(df, st_col=None, hide_index=True):
		"""
		Show table in Streamlit application

		Parameters
		----------
		df: pandas.DataFrame
		st_col: st.columns object
		hide_index: bool
			Whether to display (True) or hide (False)
			the indices of the displayed pandas
			DataFrame
		"""
    if hide_index:
        hide_table_row_index = """
                <style>
                tbody th {display:none}
                .blank {display:none}
                </style>
                """
        st.markdown(hide_table_row_index, unsafe_allow_html=True)

    if st_col is None:
        st.table(df)
    else:
        st_col.table(df)
Use this code to download a table:
def encode_st_df(df):
		"""
		Encode pandas DataFrame in utf-8 format

		Parameters
		----------
		df: pandas.DataFrame
		"""
    return df.to_csv(sep="\\t", index=False).encode("utf-8")

def download_st_df(df, file_name, download_text, st_col=None):
		"""
		Download pandas DataFrame in Streamlit application

		Parameters
		----------
		df: pandas.DataFrame
		file_name: str
			Name of file (e.g., rascore_table.tsv)
		download_text: str
			Text on download button (e.g., Download Table)
		st_col: st.columns object
		"""
    if st_col is None:
        st.download_button(
            label=download_text,
            data=encode_st_df(df),
            file_name=file_name,
        )
    else:
        st_col.download_button(
            label=download_text,
            data=encode_st_df(df),
            file_name=file_name,
        )
How to visualize the 3D structure of human proteins
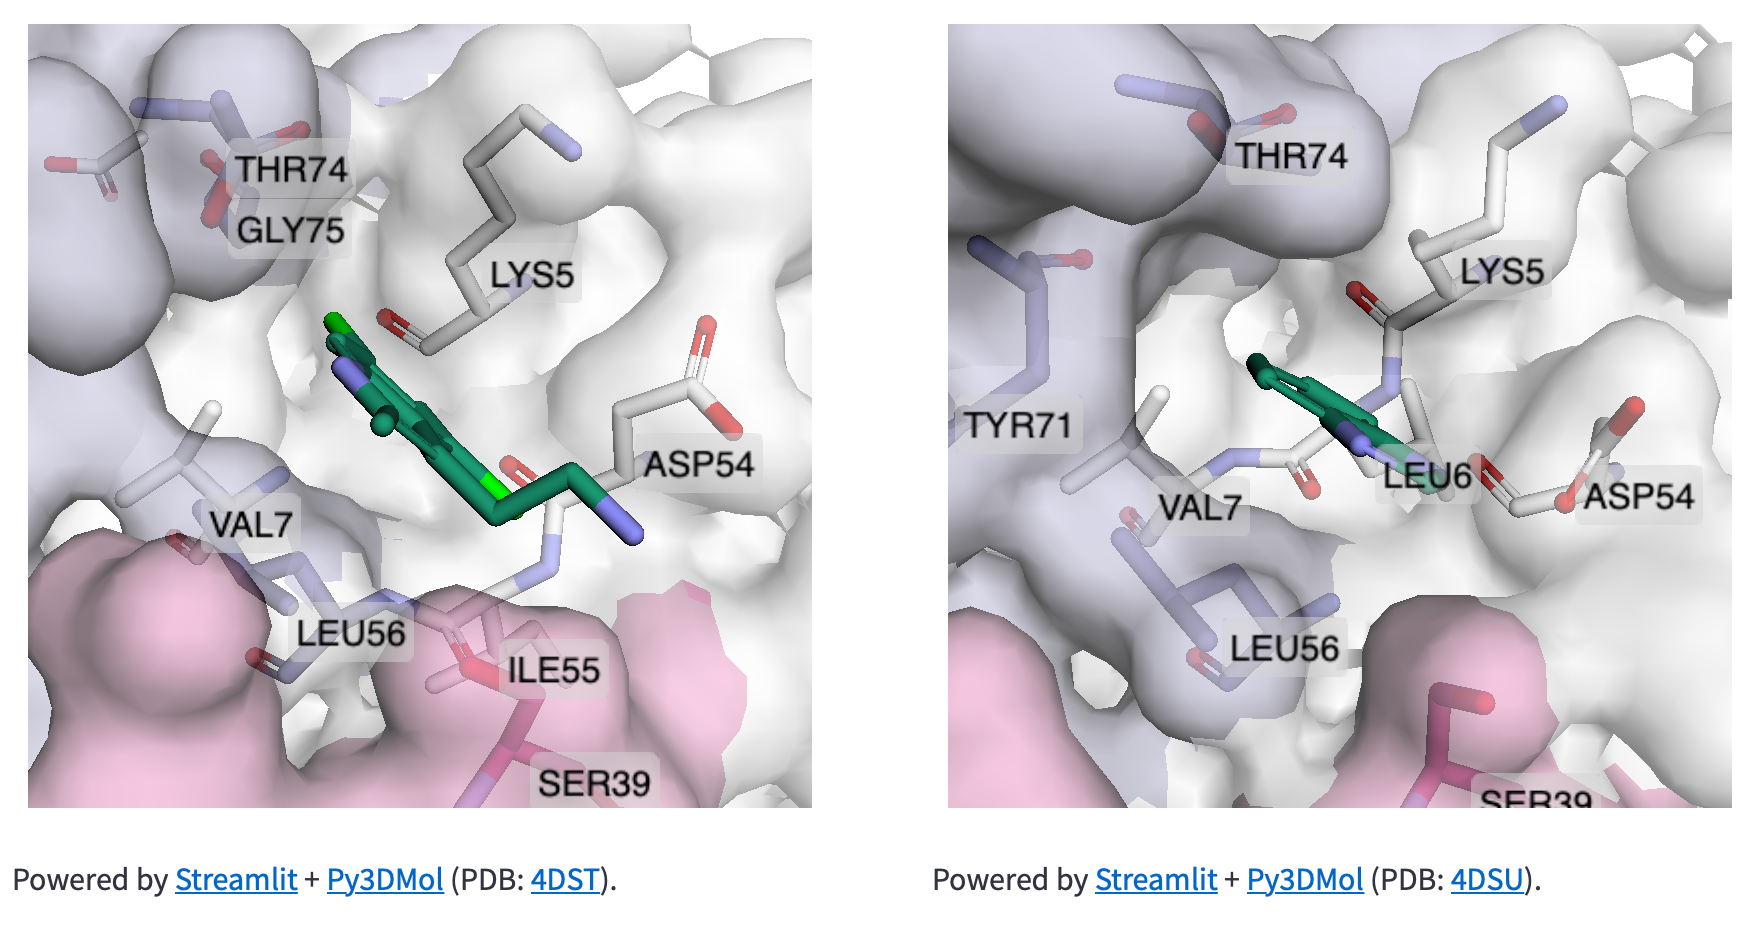
The data in Rascore relates only to the 3D structure of RAS proteins. We wanted researchers to compare structural models with different cancer-associated mutations or bound drugs.
Luckily, José Manuel Nápoles Duarte made a Streamlit plugin for visualizing protein structures by using Py3DMol. But Py3DMol doesn’t highlight protein structure parts like drug binding sites. So we created a highlighting function.
Below are the input values for parameters ending in “_lst”. They’re non-intuitive and relate to highlighting selected parts of protein structures. Each “_lst” takes a nested list as the input with a required object at each index of each sublist (see this doc for making a selection and coloring dictionaries):
| Parameter | Purpose | Index 0 | Index 1 | Index 2 |
|---|---|---|---|---|
| style_lst | To stylize parts of protein structures by changing 3D representation or coloring scheme | Selection Dictionary (e.g., {"chain":"A", "rest": "25-40"]\} | Coloring Dictionary (e.g., {"stick": {"colorscheme": "amino", "radius": 0.2}}) | NA |
| label_lst | To apply custom labels to certain parts of protein structure | Label String | Coloring Dictionary | Selection Dictionary |
| reslabel_lst | To apply standard labels to residue (amino acid identity and linear position) | Selection Dictionary | Coloring Dictionary | NA |
| surface_lst | To add surface over 3D representation of protein structures | Coloring Dictionary | Selection Dictionary | NA |
Here is the code:
import py3Dmol
from stmol import showmol

def show_st_3dmol(
    pdb_code,
    style_lst=None,
    label_lst=None,
    reslabel_lst=None,
    zoom_dict=None,
    surface_lst=None,
    cartoon_style="trace",
    cartoon_radius=0.2,
    cartoon_color="lightgray",
    zoom=1,
    spin_on=False,
    width=900,
    height=600,
):

"""
Show 3D view of protein structure from the
Protein Data Bank (PDB)

Parameters
----------
pdb_code: str
	Four-letter code of protein structure in the PDB
	(e.g., 5P21)
style_lst: list of lists of dicts
	A nested list with each sublist containing a
	selection dictionary at index 0 and coloring
	dictionary at index 1
label_lst: list of lists of dicts
	A nested list with each sublist containing a
	label string at index 0, coloring dictionary
	at index 1, and selection dictionary at
	index 2
reslabel_lst: list of lists of dicts
	A nested list with each sublist containing a
	selection dictionary at index 0 and coloring
	dictionary at index 1
zoom_dict: dict
surface_lst: list of lists of dicts
	A nested list with each sublist containing a
	coloring dictionary at index 0 and selection
	dictionary at index 1
cartoon_style: str
	Style of protein structure backbone cartoon
	rendering, which can be "trace", "oval", "rectangle",
	"parabola", or "edged"
cartoon_radius: float
	Radius of backbone cartoon rendering
cartoon_color: str
	Color of backbone cartoon rendering
zoom: float
	Level of zoom into protein structure
	in unit of Angstroms
spin_on: bool
	Boolean specifying whether the visualized
	protein structure should be continually
	spinning (True) or not (False)
width: int
	Width of molecular viewer
height: int
	Height of molecular viewer
"""
    view = py3Dmol.view(query=f"pdb:{pdb_code.lower()}", width=width, height=height)

    view.setStyle(
        {
            "cartoon": {
                "style": cartoon_style,
                "color": cartoon_color,
                "thickness": cartoon_radius,
            }
        }
    )

    if surface_lst is not None:
        for surface in surface_lst:
            view.addSurface(py3Dmol.VDW, surface[0], surface[1])

    if style_lst is not None:
        for style in style_lst:
            view.addStyle(
                style[0],
                style[1],
            )

    if label_lst is not None:
        for label in label_lst:
            view.addLabel(label[0], label[1], label[2])

    if reslabel_lst is not None:
        for reslabel in reslabel_lst:
            view.addResLabels(reslabel[0], reslabel[1])

    if zoom_dict is None:
        view.zoomTo()
    else:
        view.zoomTo(zoom_dict)

    view.spin(spin_on)

    view.zoom(zoom)
    showmol(view, height=height, width=width)
How to make informative data plots
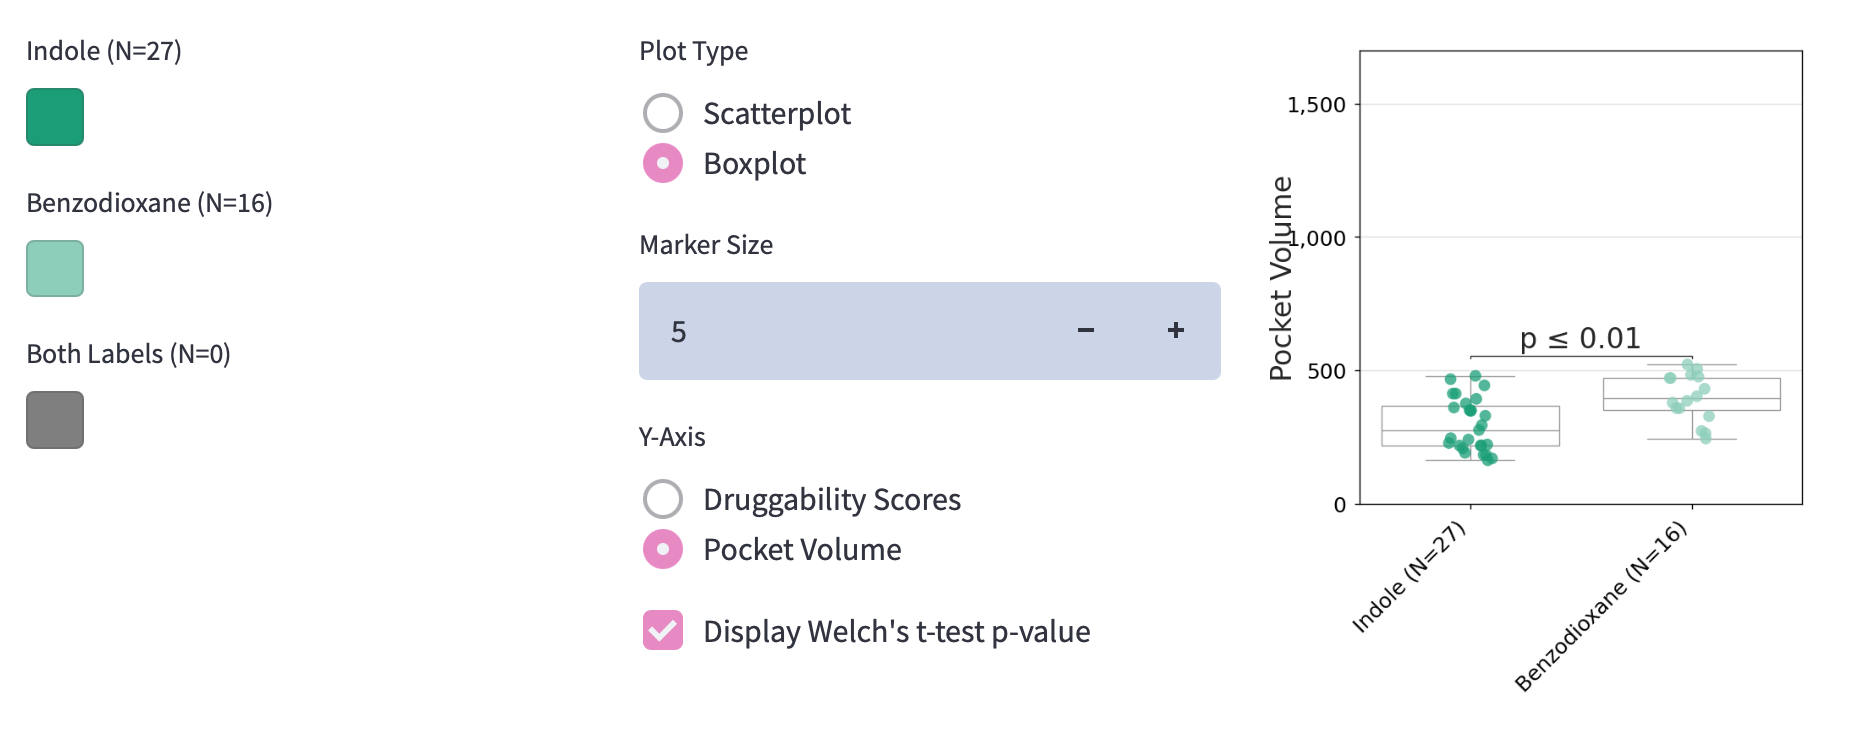
Visual comparison of individual RAS structures is great, but there are hundreds of them to sift through.
We created an easy way to compare calculated metrics across RAS structures of different groups such as druggability score or pocket volumes. Possible data visualizations are scatterplots and box plots. You can make them with Matplotlib and load them into your app by using this function:
import streamlit as st
from io import BytesIO

def show_st_fig(fig, st_col=None):
    byt = BytesIO()
    fig.savefig(byt, format="png")
    if st_col is None:
        st.image(byt)
    else:
        st_col.image(byt)
Wrapping up
Rascore is an app for researchers to explore the 3D structural models of cancer-associated RAS proteins. Streamlit gave us easy dataset navigation, 3D protein structures visualization, and plotted data display. We hope more researchers use Streamlit to share their study results with the scientific community!
If you have questions, please post them in the comments below or reach out to us on Twitter at @Mitch_P and @RolandDunbrack or email us at mip34@drexel.edu and roland.dunbrack@gmail.com.
Thank you for reading our story, and happy app-building! 🎈


Comments
Continue the conversation in our forums →