Trying to find the best approach to improving data quality? We know this pain. That’s why we created an app to automate data preprocessing and educate aspiring and experienced data scientists about improving data quality. We chose Streamlit for its ease of development and called our app Sogeti’s Data Quality Wrapper (DQW).
In this post, you’ll learn how to use DQW to preprocess:
- Structured data
- Text data
- Audio data
- Image data
TL;DR? Go to the app straight away.🚀 Or jump into the code! 👩🏽💻
But before we dive into the fun stuff, let’s talk about...
What’s the purpose of DQW?
Sogeti is the Technology and Engineering Services Division of Capgemini. We’re an IT consultancy for testing, cloud, cyber security, and AI. Sogeti NL’s data science team (where I work) is always looking for ways to automate our workflow. We made DQW as part of ITEA IVVES—a project that focuses on testing AI models in various development phases.
Another product we’re developing is in this project is the Quality AI Framework. To ensure data quality, we use DQW in its initial Data Understanding and Data Preparation phases:
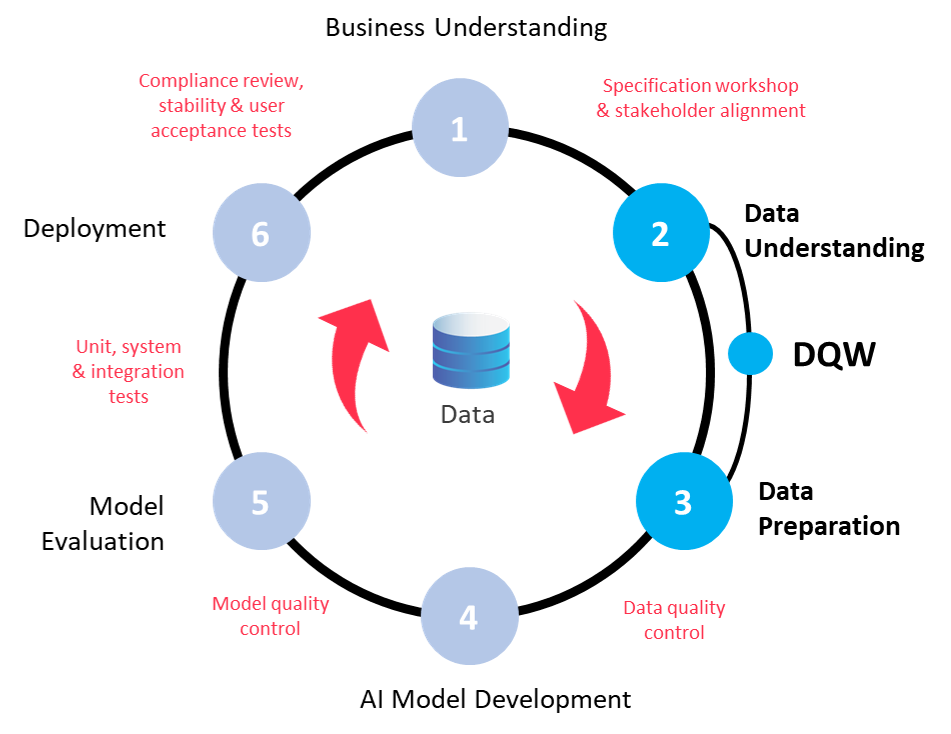
DQW is an accelerator for the Quality AI Framework. It demonstrates the functionality of useful packages and methods around data handling and preprocessing:
| App (sub)section | Description | Visualization | Preprocessing | Package |
|---|---|---|---|---|
| Synthetic structured | x | x | table-evaluator | |
| Structured | x | x | sweetviz | |
| Structured | x | x | pandas-profiling | |
| Structured, text | x | PyCaret | ||
| Text | x | x | NLTK | |
| Text | x | x | spaCy | |
| Text | x | x | TextBlob | |
| Text | x | x | word_cloud | |
| Text | x | x | Textstat | |
| Image | x | x | x | Pillow |
| Audio | x | x | librosa | |
| Audio | x | x | dtw | |
| Audio | x | audiomentations | ||
| Audio | x | x | AudioAnalyzer | |
| Report generation | x | FPDF | ||
| Report generation | x | wkhtmltopdf | ||
| Report generation | x | PDFKit |
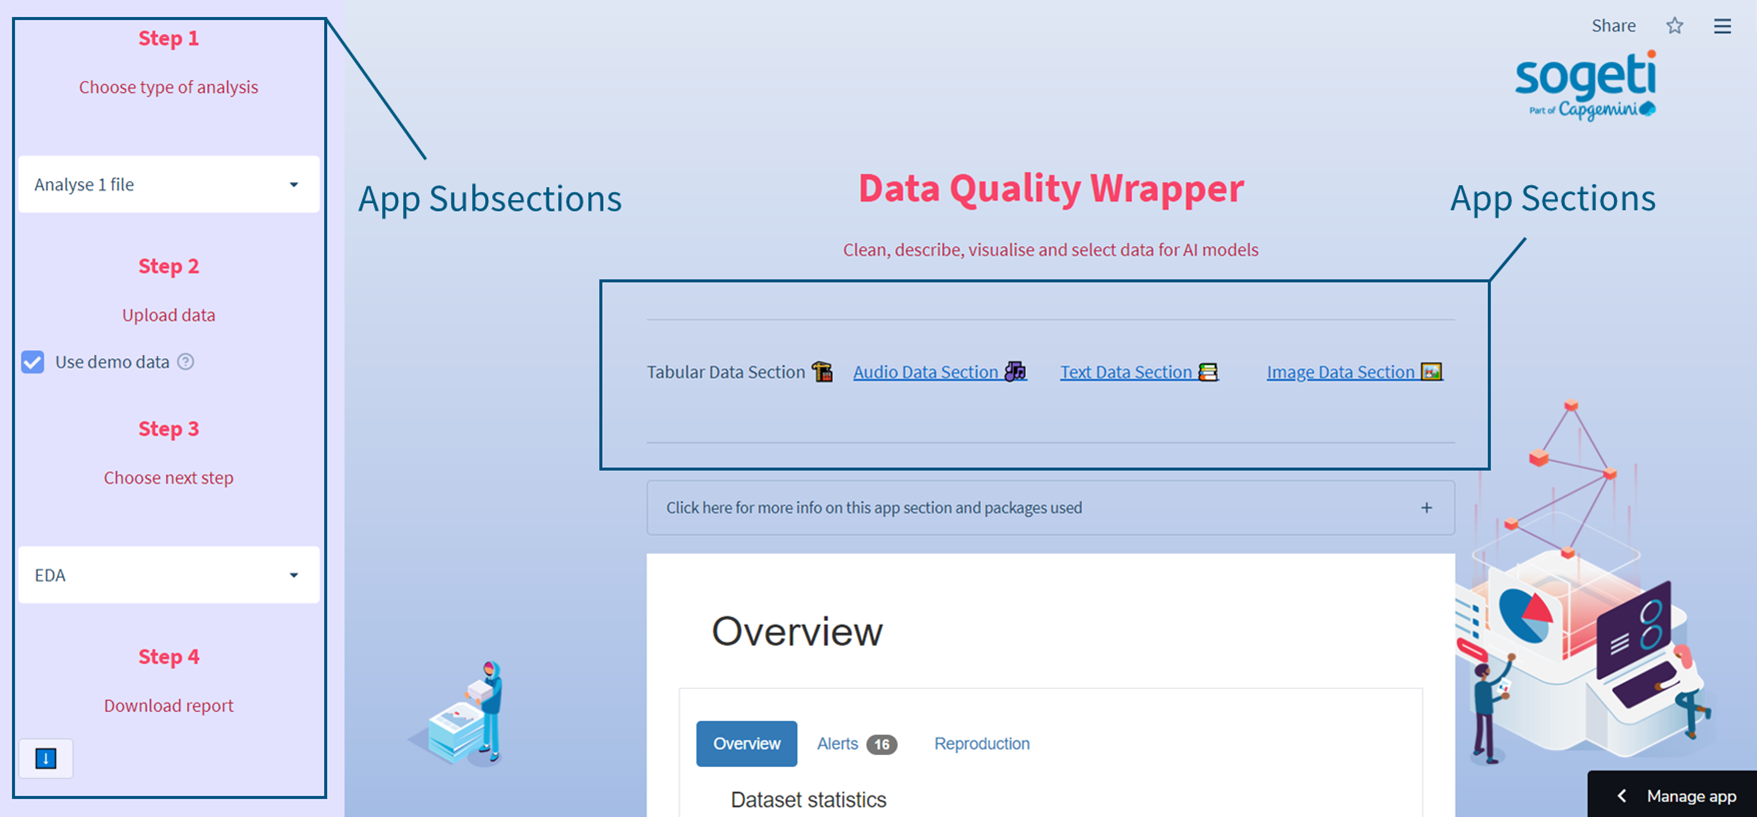
You can use DQW to preprocess structured data (synthetic data included!), text, images, and audio. Use the main selectbox to navigate through these data formats. Follow the Steps in the sidebar to navigate through the subsections:
How to preprocess structured data
The main page of the app offers structured data analysis. Structured data is data in a well-defined format used in various ML applications. The app offers one-file analysis and preprocessing, two-file comparison, and synthetic data evaluation.
How to analyze one file
Select one file analysis in Step 1, upload your file in Step 2, and select EDA in Step 3. You can also download the report in Step 4. Coding this was easy thanks to the Streamlit pandas-profiling component:
import streamlit as st
import pandas_profiling
from streamlit_pandas_profiling import st_profile_report

uploaded_data = st.sidebar.file_uploader('Upload dataset', type='csv')
data = pd.read_csv(uploaded_data)

# create the pandas profiling report
pr = data.profile_report()
st_profile_report(pr)
# optional, save to file
pr.to_file('pandas_prof.html')
How to preprocess one file
Select one file analysis in Step 1, upload your file in Step 2, select Preprocess and compare in Step 3. In Steps 4 and 5 you can download the report, the files, and the pipeline pickle:
In this subsection, we use PyCaret—a workflow automation package. Streamlit widgets make it easy to select which preprocessing steps you want to run. You can display these steps as a diagram, compare the original and the preprocessed file, and download the report, the files, and the pipeline pickle. The pipeline pickle helps you use PyCaret modeling functions, especially in the case of imbalanced class mitigation with SMOTE. The code used is in the structured_data.py script (see preprocess and show_pp_file functions).
How to compare two files
Select two file comparison in Step 1, upload your files in Step 2, and download the report in Step 3. In this subsection, we use Sweetviz—an automated EDA library in Python. And to show the report on the app, we use the Streamlit HTML components function:
import streamlit as st
import streamlit.components.v1 as components
import sweetviz as sv

uploaded_ref = st.sidebar.file_uploader('Upload reference dataset', type='csv')
ref= pd.read_csv(uploaded_ref)

uploaded_comparison = st.sidebar.file_uploader('Upload comparison dataset', type='csv')
comparison = pd.read_csv(uploaded_comparison)

sw = sv.compare([ref, 'Reference'], [comparison, 'Comparison'])

sw.show_html(open_browser=False, layout='vertical', scale=1.0)

display = open('SWEETVIZ_REPORT.html', 'r', encoding='utf-8')

source_code = display.read()

# you can pass width as well to configure the size of the report
components.html(source_code, height=1200, scrolling=True)
How to evaluate synthetic data
Select synthetic data comparison in Step 1, upload your files in Step 2, choose one of the two package methods in Step 3, and download the report and the files in Step 4. Here we use the table-evaluator package. It checks all statistical properties (PCA included) and offers multiple model performance comparisons with the original and synthetic dataset:
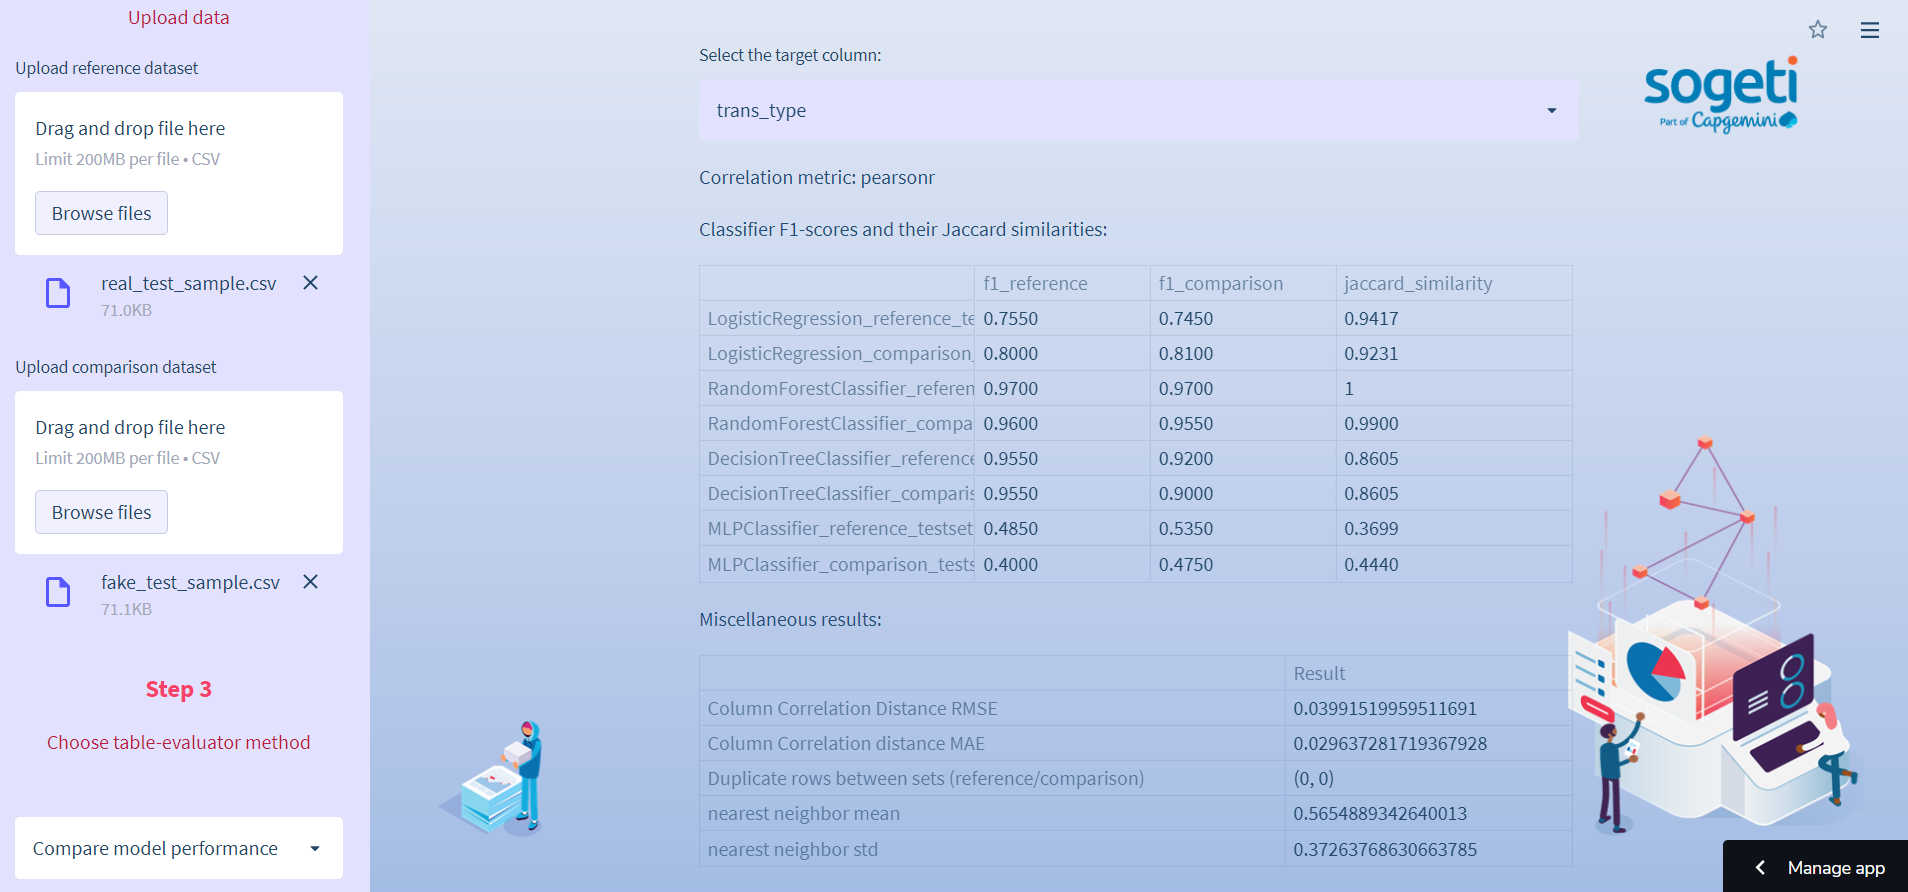
The code is in the structured_data.py (table_evaluator_comparison), te.py, viz.py, and metrics.py. The report and the files are zipped. Here is the code used in the app:
def generate_zip_structured(original, comparison):
    """ A function to write files to disk and zip 'em """
    original.to_csv('pdf_files/synthetic_data/reference_file_dqw.csv',
               index=False)
    comparison.to_csv('pdf_files/synthetic_data/comparison_file_dqw.csv',
               index=False)
    # create a ZipFile object
    dirName = "pdf_files/synthetic_data"
    with ZipFile('pdf_files/synthetic_data.zip', 'w') as zipObj:
        # Iterate over all the files in directory
        for folderName, subfolders, filenames in os.walk(dirName):
        	for filename in filenames:
        		#create complete filepath of file in directory
        		filePath = os.path.join(folderName, filename)
        		# Add file to zip
        		zipObj.write(filePath, basename(filePath))

zip = generate_zip_structured(original, comparison)

# sidebar download, you can remove the sidebar api to have the normal download button
with open('pdf_files/synthetic_data/report_files_dqw.zip', 'rb') as fp:
	st.sidebar.download_button(
	'⬇️',
	data=fp,
	file_name='te_compare_files_dqw.zip',
	mime='application/zip'
	)
How to preprocess text data
Text data is unstructured and is used in NLP models. The text data section offers the flexibility of pasting a body of text or uploading a CSV/JSON file for analysis. Currently, it supports only English, but it offers a lot of analysis methods and automated data preprocessing.
How to preprocess data
Select your data input method in Step 1 and run preprocessing:
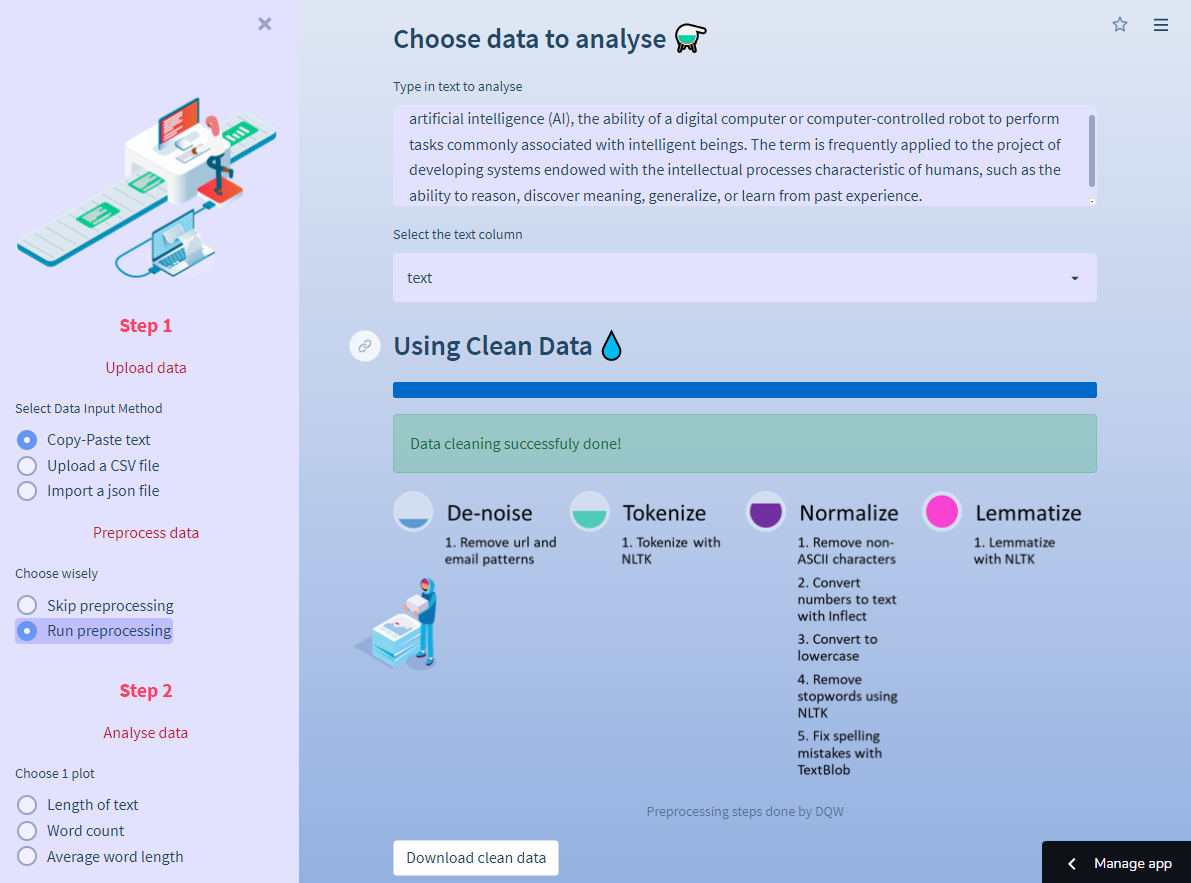
This subsection relies on multiple text-preprocessing functions like stemming, lemmatization, de-noising, and stop-word removal. These steps prepare text data in a machine-readable way. You can download the preprocessed file. The code is in the preprocessor.py script.
How to do topic analysis with LDA
Select your data input method in Step 1, run preprocessing (optional), and select topic modeling in Step 2. Choose the topics you want to run or calculate the optimal number of topics based on the u_mass coherence score. LDA topics are visualized in an interactive plot by using pyLDAvis. The code is in the lda.py script:
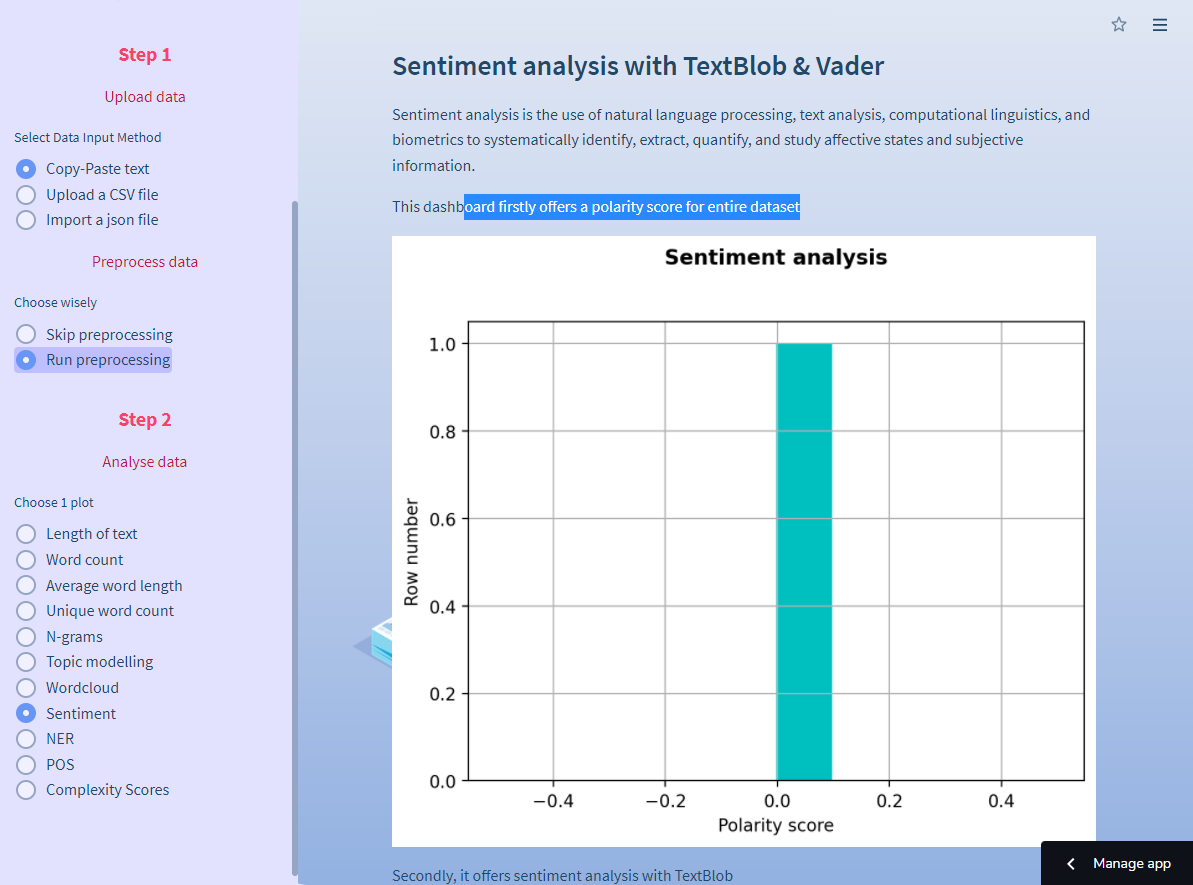
How to do sentiment analysis
Select your data input method in Step 1, run preprocessing (optional) and select sentiment in Step 2. You can do sentiment analysis with Vader and textblob. It’s an easy way to get the polarity of input text data. The code is in the polarity.py script:
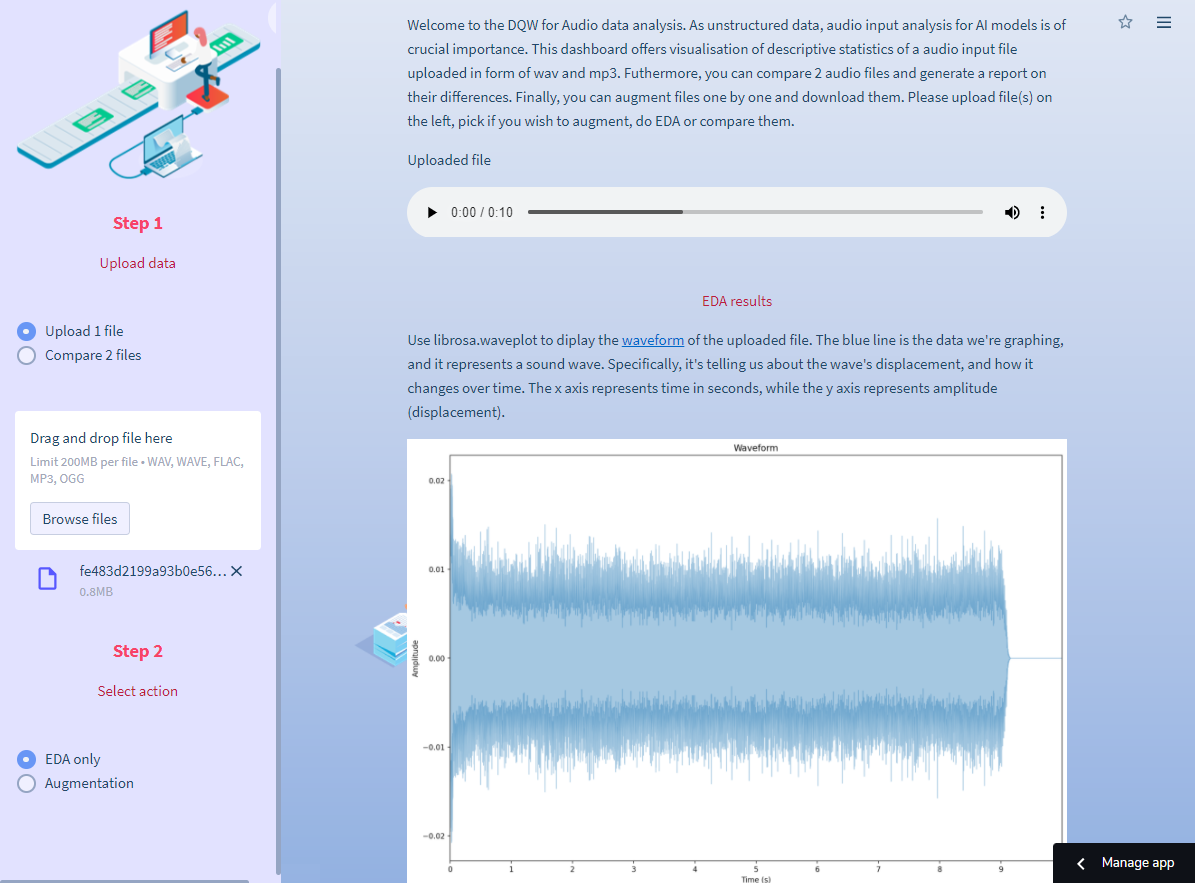
How to preprocess audio data
Audio data is unstructured and used in audio signal processing algorithms such as music genre recognition and automatic speech recognition. The audio data section offers data augmentation, EDA, and comparison of two audio files.
How to analyze one file
Upload one file in Step 1 and select EDA only in Step 2. We use plots with librosa to describe the input audio file. The plot descriptions are in the app. The code is in the audio_data.py script, function audio_eda:
To upload and display the audio file widget, use this code:
import streamlit as st

audio_file = st.sidebar.file_uploader(label="",
type=[".wav", ".wave", ".flac", ".mp3", ".ogg"])

st.audio(audio_file , format="audio/wav", start_time=0)
How to augment one file
Upload one file in Step 1 and select Augmentation in Step 2. We use audiomentations—a library for the augmentation of audio files. It increases the robustness of the dataset in the case of a lack of training data. The app also runs EDA on the augmented file.
The code is in the audio_data.py script, function augment_audio. Pass the selected augmentation methods to this function with the Streamlit multiselect API, parse the user input as an expression argument, and evaluate it as a Python expression:
import streamlit as st
from audiomentations import Compose, AddGaussianNoise, TimeStretch, PitchShift, Shift

audio_file = st.sidebar.file_uploader(label="",
type=[".wav", ".wave", ".flac", ".mp3", ".ogg"])

augmentation_methods = st.multiselect('Select augmentation method:',
['AddGaussianNoise',
'TimeStretch',
'PitchShift',
'Shift'])

# add p values to each method and eval parse all list elements
# so they are pushed to global environment as audiomentation methods
augmentation_list = [i + "(p=1.0)" for i in augmentation_methods]
augmentation_final = [eval(i) for i in augmentation_list]

# pass the list to augmentation
augment = Compose(augmentation_list)
How to compare two files
Upload two files in Step 1 and select Spectrum Compare or DTW in Step 2. We compare two files with Dynamic Time Warping (DTW), a method for analyzing the maximum path to the similarity of two time-series inputs. The code is in the audio_data.py script and the function is compare_files. Or we compare two files with audio analyser, a method that compares two spectrums with an applied threshold. The code is in the audio_data.py script and the function is audio_compare:
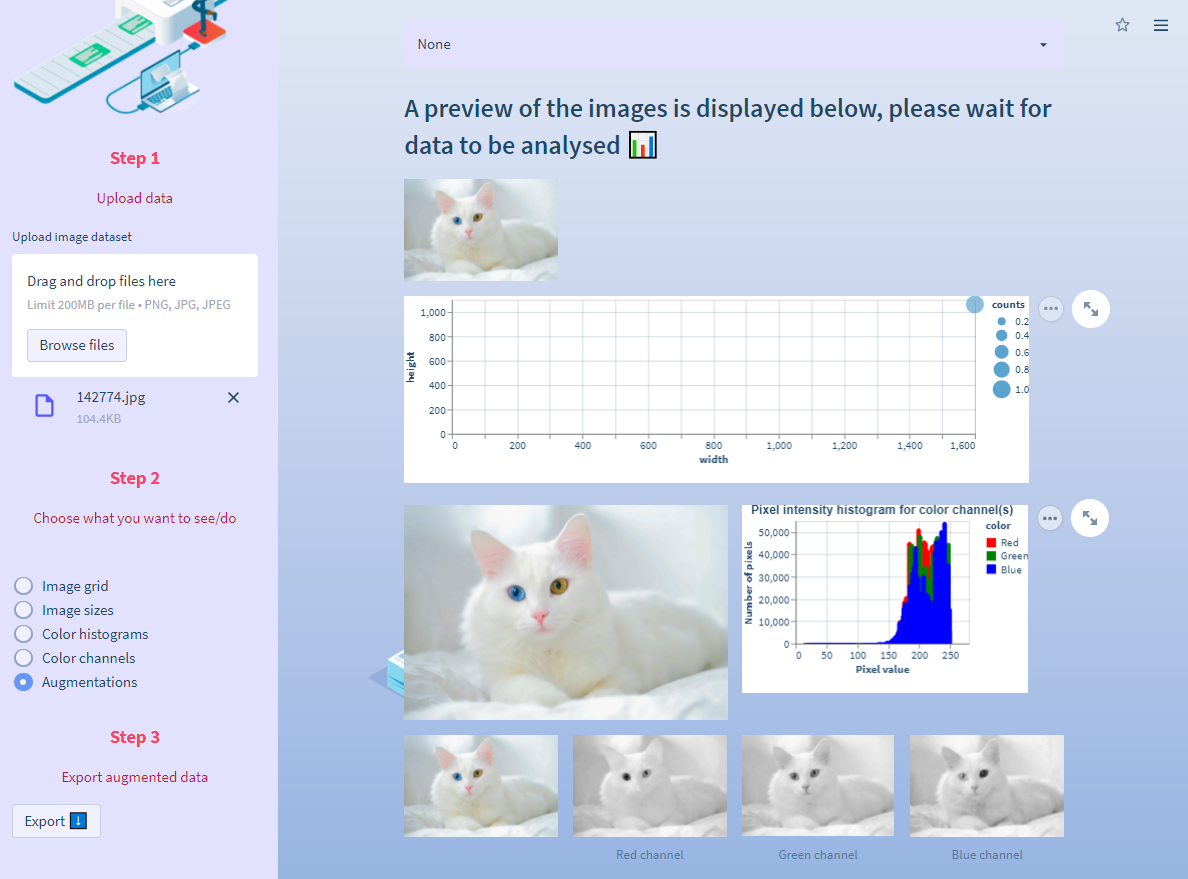
How to preprocess image data
The image data section offers data augmentation and EDA of your images.
How to augment images
Upload a dataset in Step 1, select Augmentations in Step 2, and download data in Step 3. here we use Pillow. It offers image resizing, noise application, and contrast and brightness adjustment. Thanks to session state you can apply multiple augmentations in a sequence and go back to the previous state if you need to. The code is in the augment.py script:
BONUS: A few handy tricks for app design
You can find a lot of helpful design functions in the helper_functions.py script. Here are a few tricks I use for all my Streamlit apps:
Local file as a background hack. This is a lifesaver. Simply use this code to pass a local file and open it as background:
def set_bg_hack(main_bg):
	'''
	A function to unpack an image from root folder and set as bg.

	Returns
	-------
	The background.
	'''
	# set bg name
	main_bg_ext = "png"

	st.markdown(
	   f"""
	   <style>
	   .stApp {{
	       background: url(data:image/{main_bg_ext};base64,{base64.b64encode(open(main_bg, "rb").read()).decode()});
	       background-size: cover
	   }}
	   </style>
	   """,
	   unsafe_allow_html=True
	)
Custom themes. Streamlit offers an easy way of secondary app styling through their UI. Check it out here.
The sidebar design. You can change the width of your sidebar with this simple code:
# set sidebar width
st.markdown(
"""
<style>
[data-testid="stSidebar"][aria-expanded="true"] > div:first-child {
    width: 300px;
}
[data-testid="stSidebar"][aria-expanded="false"] > div:first-child {
    width: 300px;
    margin-left: -300px;
}
</style>
""",
unsafe_allow_html=True,
)
I prefer to move all of the high-level user-defined steps to the sidebar: upload widgets, select boxes, etc. It’s very simple. Just add .sidebar to call the relevant API:
import streamlit as st

# add a logo to the sidebar
logo = Image.open("logo.png")
st.sidebar.image(logo, use_column_width=True)

# upload widget
file = st.sidebar.file_uploader("Upload file here")

# selectbox
add_selectbox = st.sidebar.selectbox(
    "What would you like to do?",
    ("EDA", "Preprocess", "Report")
)
Passing HTML code as text. Since this is a very robust app with a lot of components that need to be explained, in some cases it’s useful to pass HTML code as text. Use this function:
def sub_text(text):
    '''
    A function to neatly display text in app.
    Parameters
    ----------
    text : Just plain text.
    Returns
    -------
    Text defined by html5 code below.
    '''

    html_temp = f"""
    <p style = "color:#1F4E79; text_align:justify;"> {text} </p>
    </div>
    """

    st.markdown(html_temp, unsafe_allow_html = True)
Expanders for more information and references. The expanders are a space-saver in robust apps with a lot of text:
import streamlit as st

info = st.expander("Click here for more info on methods used")
with info:
  st.markdown("More information")
Wrapping up
Use the DQW app to automate your data preprocessing during AI model development. It’ll streamline your workflow and ensure transparency and quality. The app is still in development and is one of the many Streamlit apps we’ve created. We hope it’ll help educate the data science community about data-centric model development and data quality methods.
If you have questions, please leave them in the comments below or reach out to me at tia.nikolic@sogeti.com or on LinkedIn.
Thank you for reading this post, and happy app-building! 🎈


Comments
Continue the conversation in our forums →