
Picture this: You’re a data scientist and the company you work for needs to make some decisions – fast! You need a way to munge the numbers, investigate emerging trends, and help your stakeholders take action on those trends. You know that a data app would be the perfect solution for the job, but you don’t have time to get bogged down in complex web development, tedious UI styling, or slow iteration cycles.
Creating interactive data applications shouldn't be this hard! 😭
This is exactly why Streamlit exists.
In this blog post, we'll cover the fundamentals of Streamlit, how it works, and how you can get started with it. You can find the example code for this post here or watch the step-by-step video tutorial on YouTube.
What is Streamlit?
Streamlit is an open-source Python framework to build highly interactive data apps – in only a few lines of code. The point of Streamlit is to allow you to focus on what’s most important to you: Your data analysis!
Intuitive syntax
One of Streamlit’s standout features is that it has intuitive default styles “baked in” so you can deploy and share polished apps with anyone anywhere. For example, to write a header, you use st.header(). To add some text, you use st.write(). Need a divider? Just use st.divider().
No CSS, HTML, or JavaScript experience required!
Seamlessly composable, AI compatible
With Streamlit, you don’t have to do any “app thinking” – you don’t have to think about the UI, the styling, or the routing. It simply extends what you’re already doing in Python.
Streamlit is compatible with a wide range of data libraries, including Pandas, NumPy, and Altair. Streamlit integrates with all the latest tools in generative AI, such as any LLM, vector database, or various AI frameworks like LangChain, LlamaIndex, or Weights & Biases. Streamlit’s chat elements make it especially easy to interact with AI so you can build chatbots that “talk to your data.”
Your go-to UI
Streamlit gets you to a working version 0 of your app faster. You can get your app in front of users faster, get feedback faster, and improve faster. Streamlit makes your iteration cycles shorter.
Today the Streamlit community has over 300k monthly active developers and is used by 80% of Fortune 50 companies. Whether you’re on a data team, a seasoned data scientist, or a new Python developer, the possibilities with Streamlit are endless.
Getting started with Streamlit using GitHub Codespaces
There are many ways to get started with Streamlit. For this blog post, we are going to use GitHub Codespaces. Codespaces is a cloud-hosted development environment where you can use an in-browser editor to start coding with Streamlit.
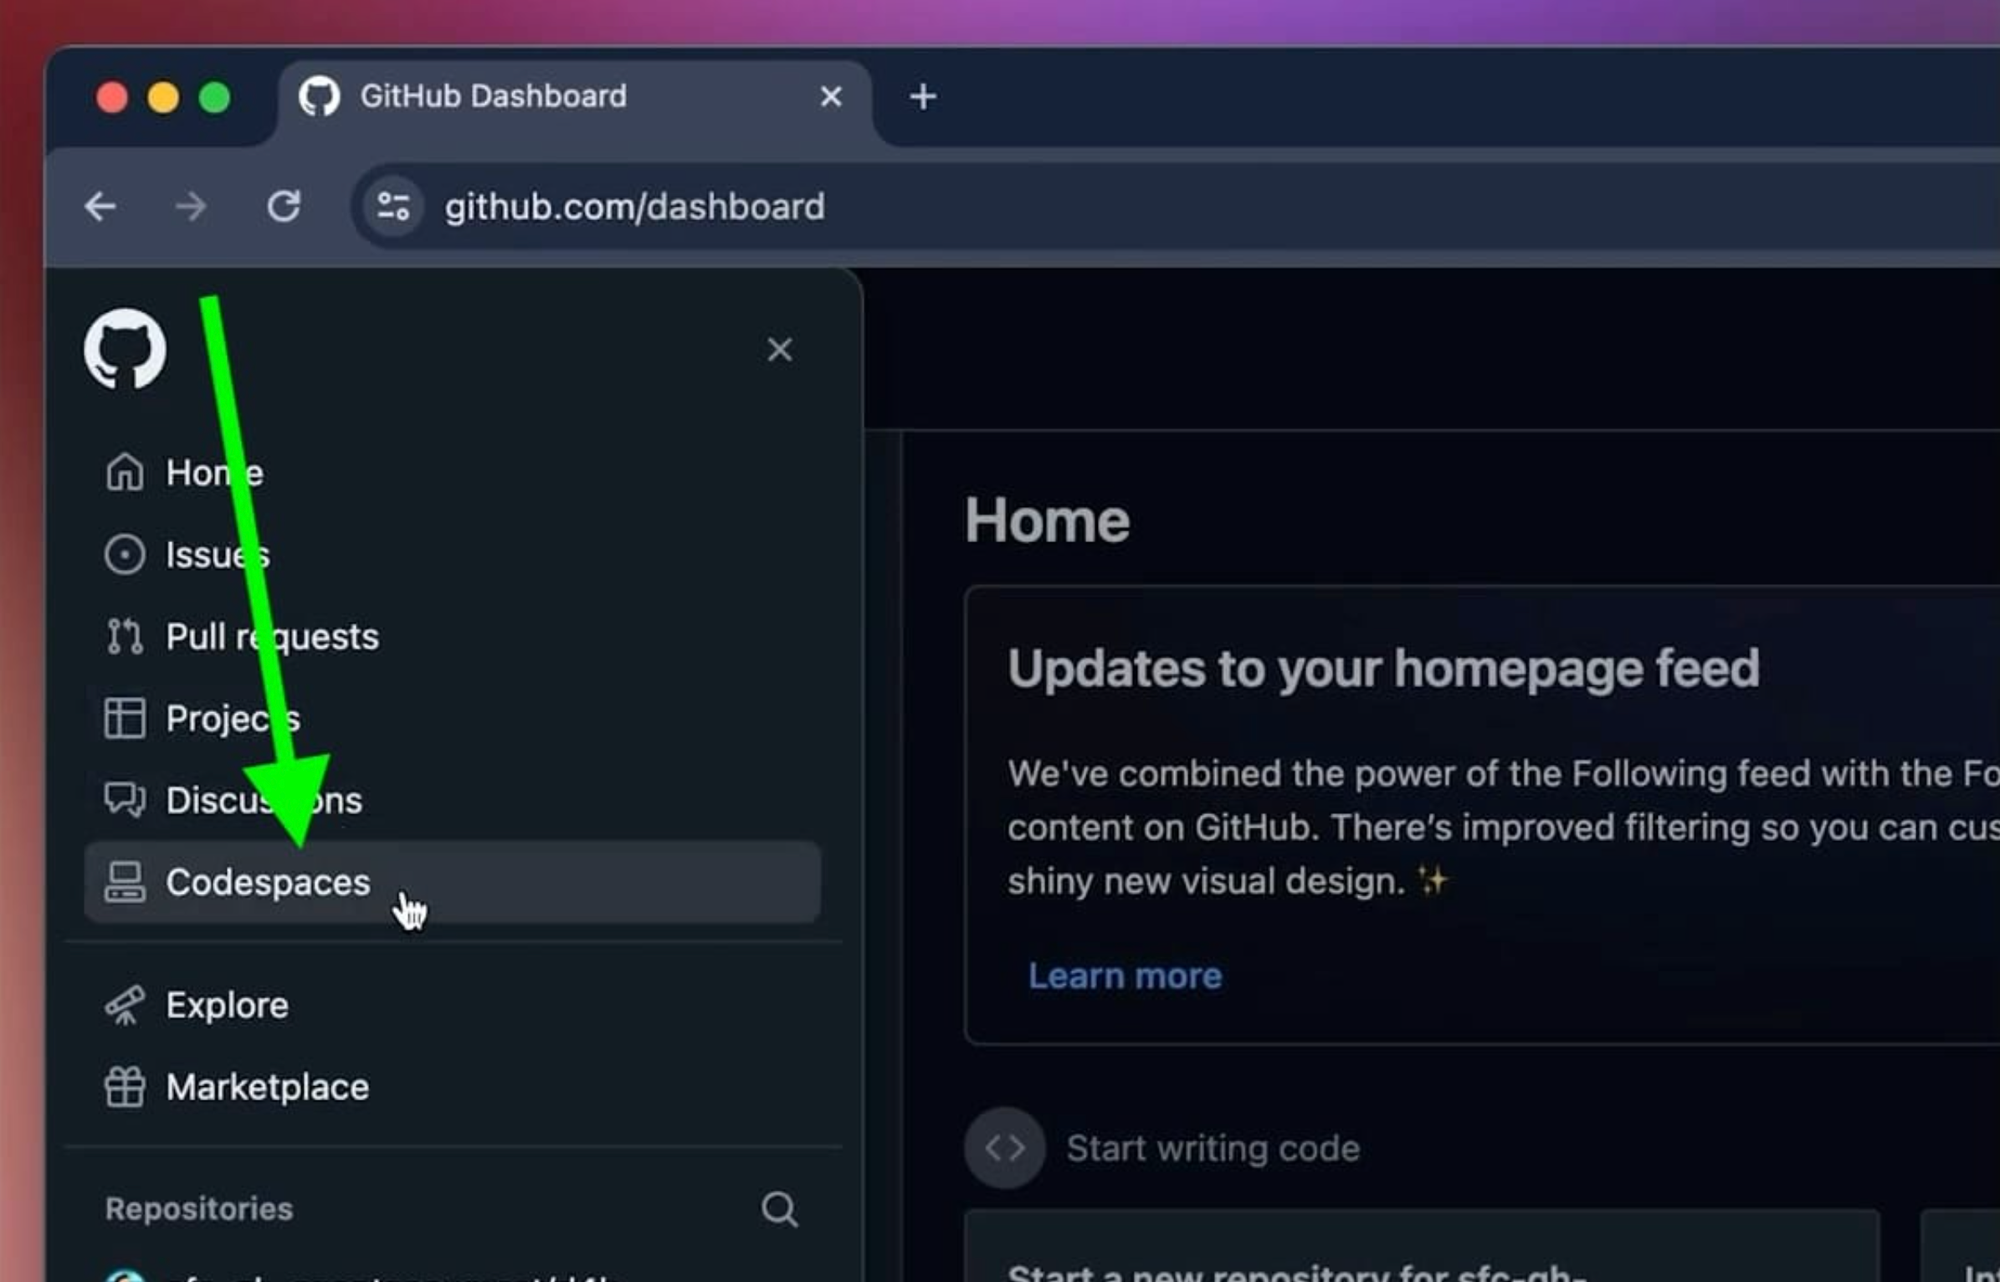
Launch Codespaces
Start by launching Codespaces from within your GitHub account.
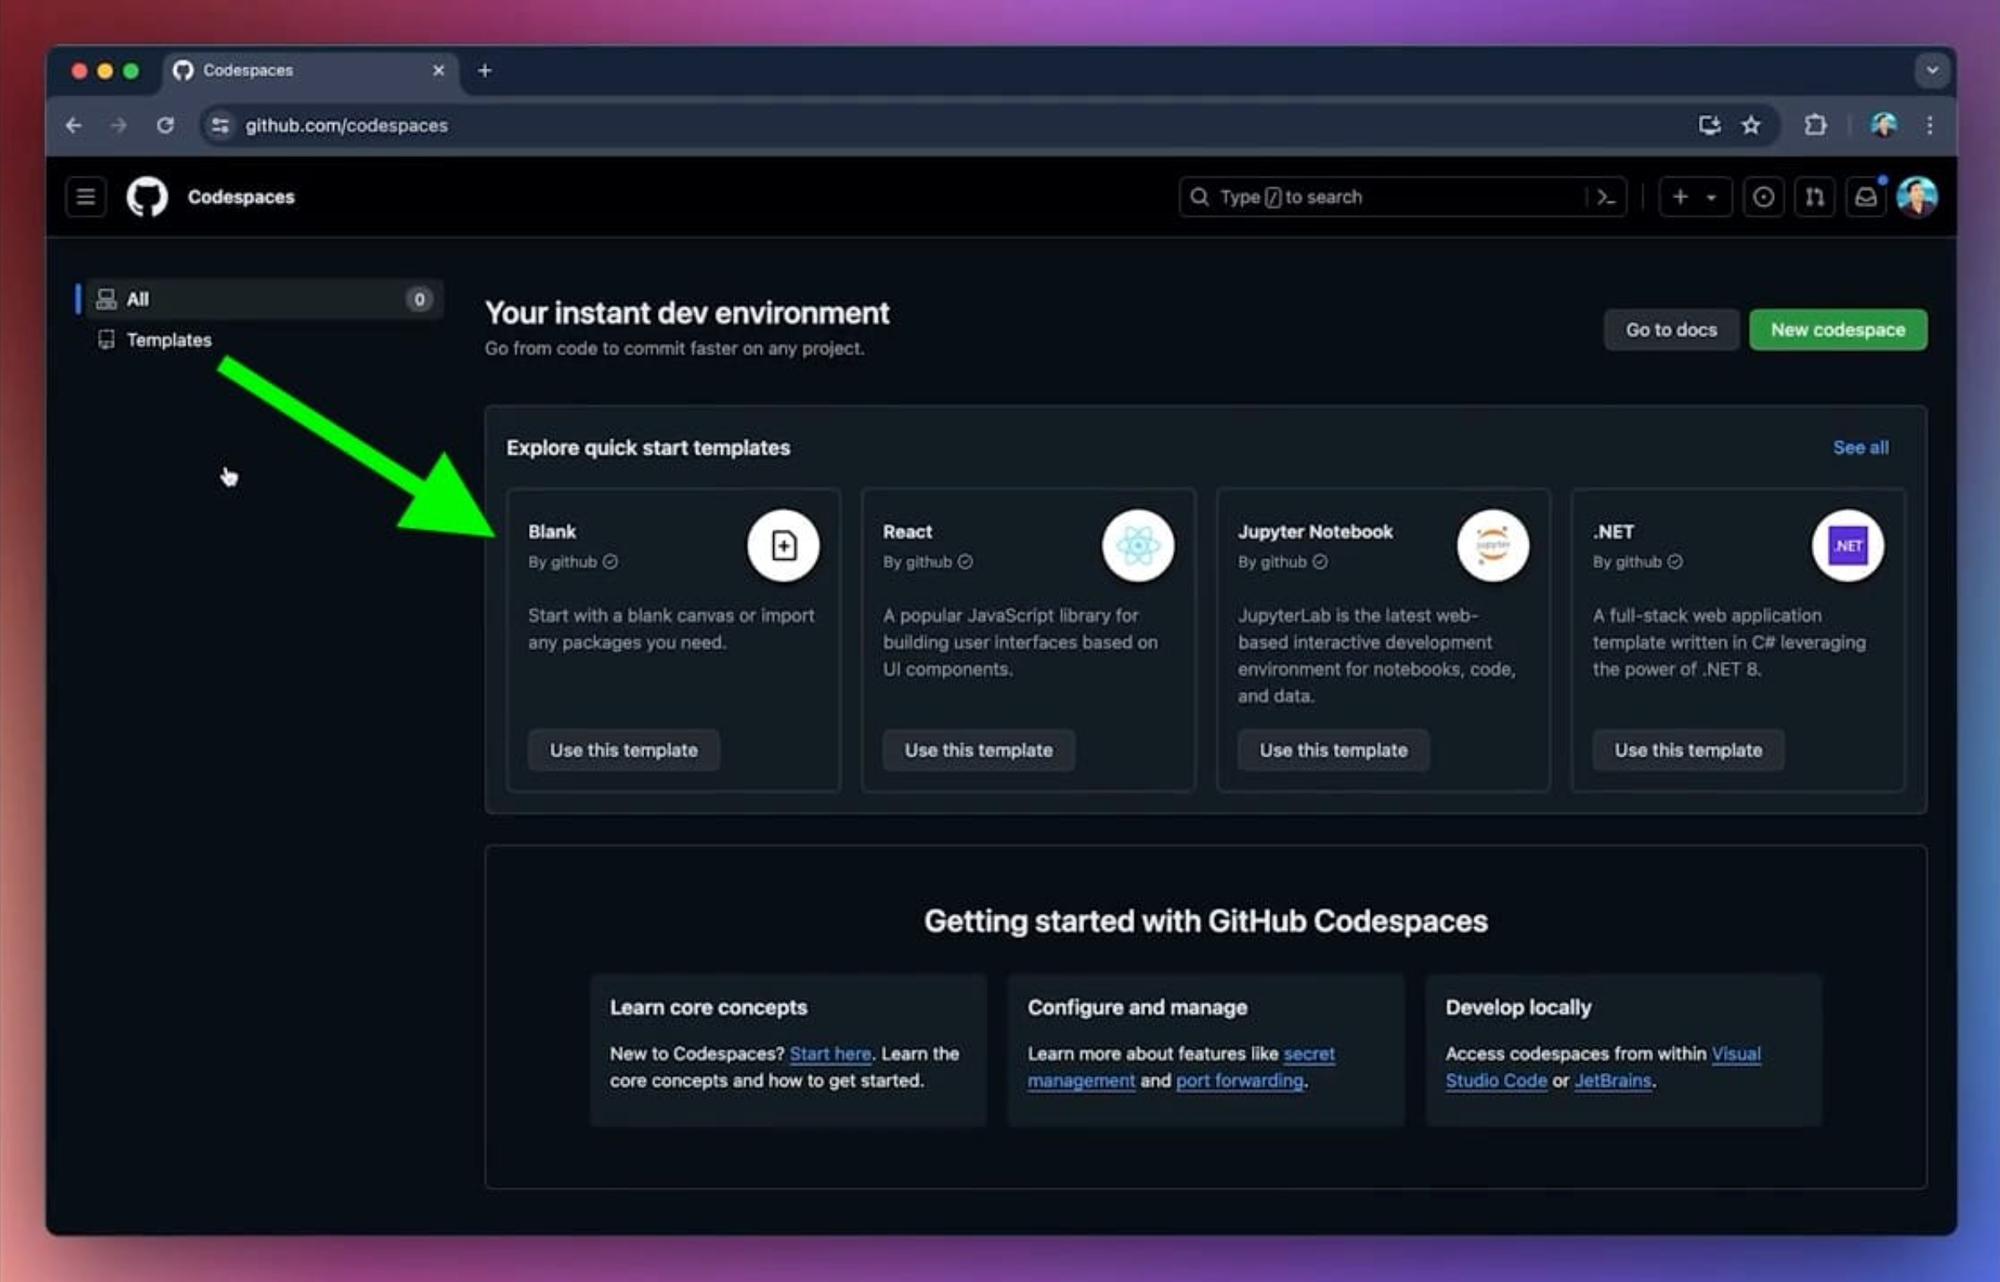
Spin up a new instance
Create a new instance using a blank Codespaces template.
Install Streamlit
Run pip install streamlit to install the framework.
pip install streamlitCreate a simple app
You can create a basic “Hello world” app in just two lines of code by creating a new Python file called streamlit_app.py and adding the following code to it:
import streamlit as st
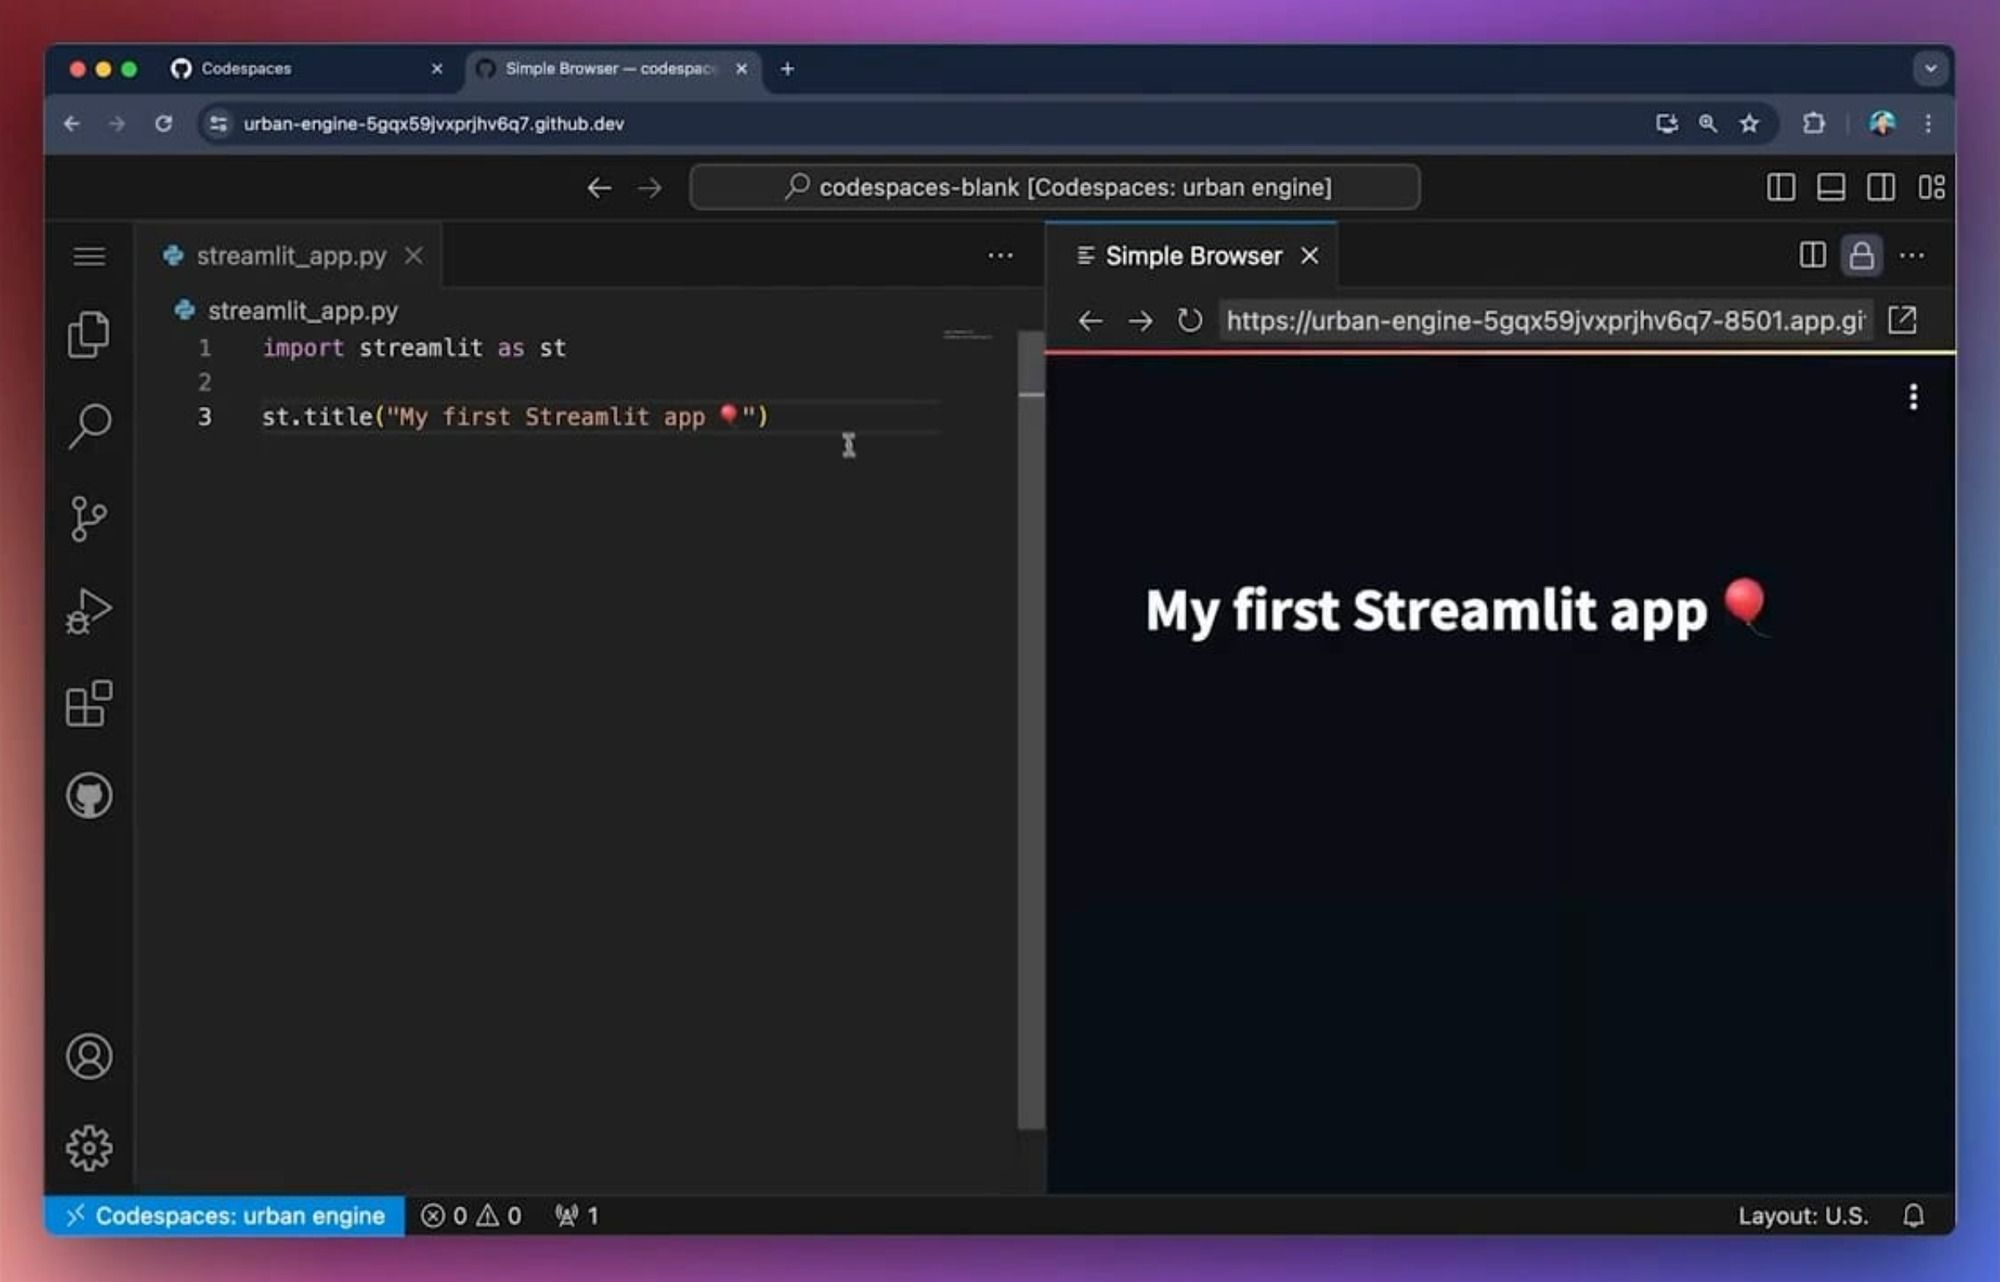
st.write("My first Streamlit app 🎈")Run your app
Run your new app with the command streamlit run streamlit_app.py.
View your app
Your app should appear in a new browser tab – see how quick that was?
Now that we have our first Streamlit app built out, let’s see how we can extend it.
Building a typical Streamlit app
The most important part of a good data app is effectively visualizing your data analysis so insights are easier to glean. Interactivity helps users explore the data.
Let’s take a look at different ways to visualize data and add interaction with Streamlit.
Load your data
Before we get into any of the example data visualizations, we need to load our data. The following code uses Pandas to create a function that loads the data from a CSV file.
Then we use the @st.cache_data decorator to speed up our app. Learn more about caching in Streamlit here.
Make sure to add Pandas to your imports before you use it.
import pandas as pd

@st.cache_data

def load_data():
  return pd.read_csv("https://github.com/dataprofessor/population-dashboard/raw/master/data/us-population-2010-2019-reshaped.csv", index_col=0)
Example 1: Inspect your data
st.data_editor displays data in an editable table.
st.header("1. Inspect the data 🔍")

st.write("`st.data_editor` allows us to display AND edit data")

st.data_editor(df)
Example 2: A simple bar chart
st.bar_chart displays the data in a bar chart form. In the following code, we create a bar chart with our data and declare the x and y axis as states and population, respectively.
st.header("2. Get started with a simple bar chart 📊")

st.write("Let's chart the US state population data from the year 2019")

st.bar_chart(df[['year', 'states', 'population']],
             x='states',
             y='population')
Example 3: Add interactivity to a bar chart
The more interactive your app, the more your data comes to life for your users. With Streamlit, it’s easy to add selection boxes, sliders, and numerical inputs so users can explore your data.
The following code contains three different types of interactivity. Comment and uncomment the code to see which one suits your needs the best.
st.header("3. Now make it interactive 🪄")

st.write("It's your turn to select a year")

# Using st.selectbox
selected_year = st.selectbox("Select a year",
                             list(df.year.unique())[::-1])

# Using st.slider
#selected_year = st.slider("Select a year", 2010, 2019)

# Using st.number_input
#selected_year = st.number_input("Enter a year",
#                                placeholder="Enter a year from 2010-2019",
#                                value=2019)

if selected_year:
    df_selected_year = df[df.year == selected_year]

    # Display chart
    st.bar_chart(df_selected_year,
                 x='states',
                 y='population')
Example 4: Integrate another Python library to create a line chart
st.altair_chart uses the Vega-Altair library to display data as a line chart. Please note that you’ll have to import Altair before you can use it.
import altair as alt

st.header("4. How about a line chart? 📈")

st.write("Track changes over time")

df_line_chart = df.copy()
df_line_chart['year'] = df_line_chart['year'].astype(str)

c = (
    alt.Chart(df_line_chart)
     .mark_line()
     .encode(x=alt.X('year'),
             y=alt.Y('population'),
             color='states')
)

st.altair_chart(c, use_container_width=True)
Example 5: Add interactivity to an Altair line chart
Like the bar chart above, you can add interactivity to a line chart with st.multiselect.
st.header("5. Sprinkle in more interactivity 🪄")

st.write("Use `st.multiselect` and `st.slider` for data filter before chart creation")

states = st.multiselect("Pick your states",
                        list(df.states.unique())[::-1],
                        "California")
date_range = st.slider("Pick your date range",
                       2010, 2019,
                       (2010, 2019))

if states:
    chart_data = df[df['states'].isin(states)]
    chart_data = chart_data[chart_data['year'].between(date_range[0], date_range[1])]
    chart_data['year'] = chart_data['year'].astype(str)

    c = (
        alt.Chart(chart_data)
         .mark_line()
         .encode(x=alt.X('year'),
                 y=alt.Y('population'),
                 color='states')
    )

    st.altair_chart(c, use_container_width=True)
The best part is you don’t have to deal with styling all of these different elements – Streamlit takes care of that for you!
Extending Streamlit functionality
And that’s just the beginning! To find the right API for your needs, check out the documentation.
While Streamlit's native framework is flexible enough for most use cases, there may be times when you need to extend its functionality. The Streamlit community has built hundreds of reusable components that you can easily integrate into your app. These custom-built components turn complex JavaScript code into a single line of Python, making it easier than ever to add advanced features to your app.
You can find available components here.
Deploying Streamlit apps
Deploying your Streamlit app is straightforward and can be done in several ways:
- Local deployment: Run your app locally.
- Server deployment: Deploy your app on your preferred server.
- Streamlit Community Cloud: A completely free way to deploy and share your apps. With millions of views each month, public apps on Streamlit Community Cloud are indexable by Google and can be discovered by anyone around the world. It's a fantastic way to showcase your creativity – whether you're building chatbots, visualizing machine learning models, creating internal tools, or working on your latest passion project.
To learn more about different deployment options, read the documentation here.
Scaling with Snowflake
If you're looking for extended scale and security, Streamlit also works seamlessly on the Snowflake platform, where all infrastructure and role-based governance are handled for you.
To learn more about Streamlit in Snowflake, refer to the documentation here.
What will you build?
Streamlit is revolutionizing the way we build and share data applications. Its speed, intuitive syntax, and seamless composability make it an invaluable tool for anyone working with data. Dive into Streamlit today and start building your own interactive data apps.
Need some inspiration? Check out the Streamlit App Gallery to see what other people are building or join the discussion in the Streamlit Forum.
We can't wait to see what you create!
Happy Streamlit-ing! 🎈


Comments
Continue the conversation in our forums →