Guest post written by Chris Klose - Data Scientist
If you're a data scientist or anyone else who likes to use network graphics, you'll want to try out the new Streamlit Agraph component to create knowledge graphs. A knowledge graph is a graph that represents knowledge about entities and their relations in a flexible manner which offers more freedom than static relational database schemas. The term was originally introduced by Google in 2012 and they wrote a great blog post called “Things not strings” about the advantages of knowledge graphs [also the short video in the blogpost is pretty awesome] .
Now let's get our hands dirty and use the Agraph component to build a simple graph.
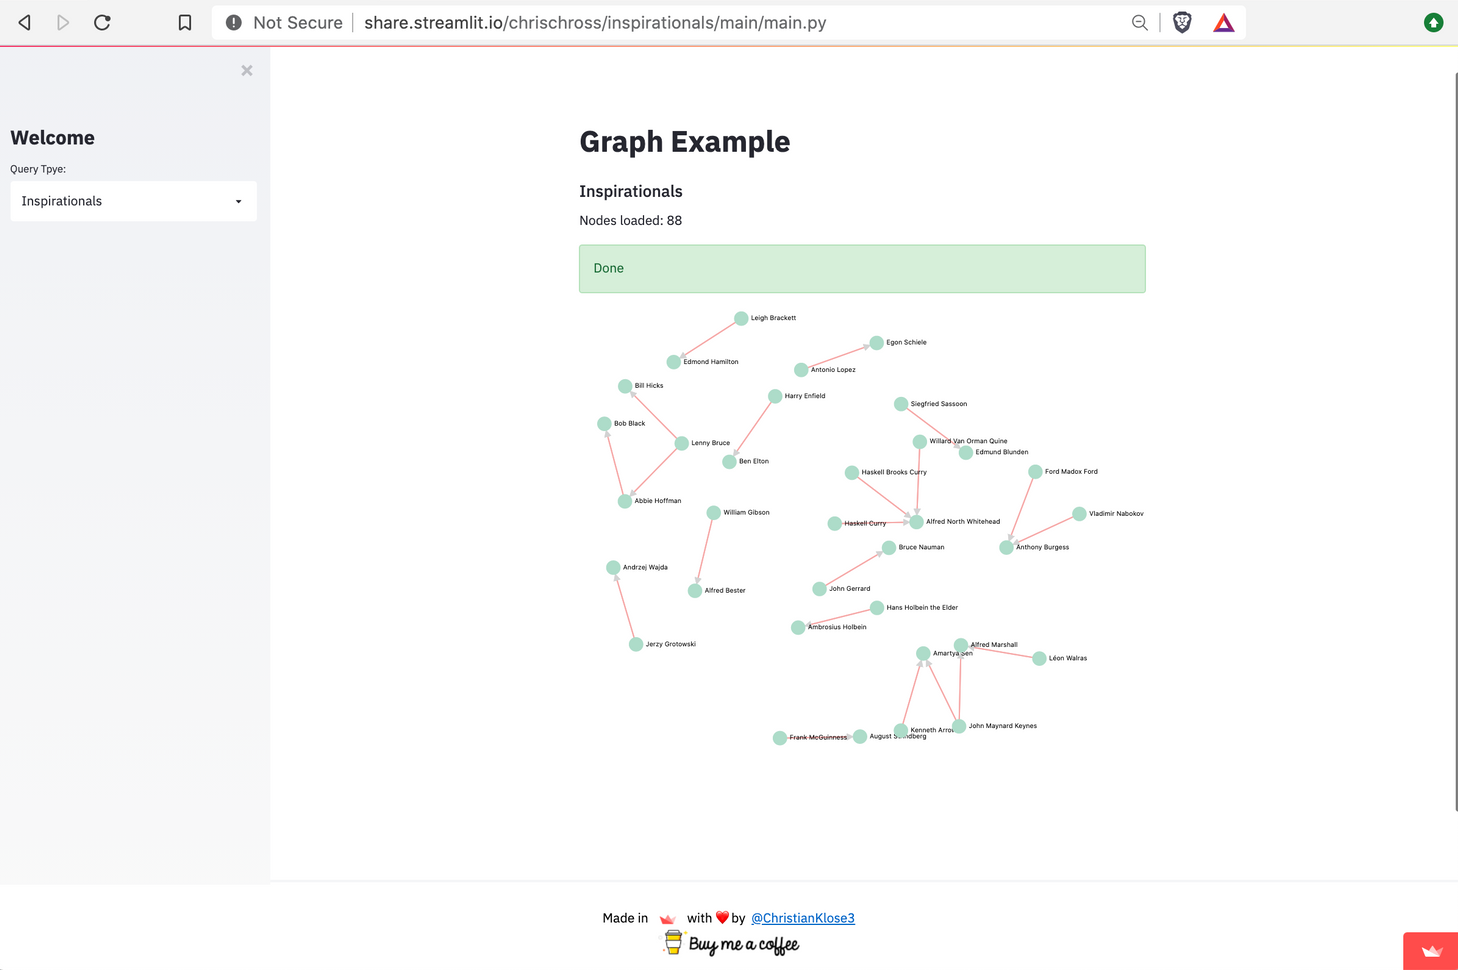
Build a graph to visualize inspirational people

For our simple graph, we want to find out how famous people were inspired - so which famous person inspired whom or by whom he/she was inspired. We also want to visualize these persons and the relationships in the graph.
To do this, we'll go through these steps:
- Query data from a SPARQL endpoint (http://dbpedia.org/sparql using SPARQLWrapper library) to get a JSON file.
- Parse from JSON to Python and then create a triple (nodes and edges representing famous people and either two types of relations 1: inspired, 2: was_inspired_by).
- Publish our app with Streamlit sharing.
Install the libraries
To follow along in the tutorial you'll need to install the following libraries in a terminal:
pip install Streamlit
pip install streamlit-agraph
pip install SPARQLWrapper
Get the data
After we've installed the needed libraries, we'll want to write a small function that defines SPARQL query and crawls the data (if you’re not familiar with sparql that's ok):
What's important to understand from this snippet?
One of the key classes of Agraph is the TripleStore - it serves as the central data store. Internally, the TripleStore consists of three sets, each belonging to the Nodes, Edges and Triples classes respectively. By using sets it's ensured that no duplicate triples, nodes or edges are added and it allows easier conversion to other data types.
New triples can be added to the TripleStore with this method:
store.add_triple(node, edge, node)We only have to pass the source node, the edge, and the target node
(Notice: the order matters in this case!).
Create the Streamlit app with TripleStore
To render an Agraph component we have to pass three parameters to the function.
1. A list of nodes where each node is an instance of the class Node.
At this point we can take advantage of the TripleStore as follows:
list(store.getNodes())2. A list of edges where each edge is an instance of the class Edge:
list(store.getEdges())3. The class offers the opportunity to define general settings for the rendering:
config = Config(height=500,
		width=700,
                nodeHighlightBehavior=True,
                highlightColor="#F7A7A6",
                directed=True,
                collapsible=True)
Finally, we can plug all three parts into the Agraph component, and can now see the results by running:
streamlit run app.py
Check it out yourself! 🙂
You can run this without TripleStore
It's not necessary to use a TripleStore. The Agraph component takes nodes and edges separately, which is due to the fact that both classes themselves provide a multitude of parameters for customization. Each instance of the class Nodes and Edges must have at least one unique identifier - which will usually be a string. For example, we could do:
nodes = []
edges = []
nodes.append(Node(id="Spiderman", size=400, svg="http://marvel-force-chart.surge.sh/marvel_force_chart_img/top_spiderman.png") )
nodes.append( Node(id="Captain_Marvel", size=400, svg="http://marvel-force-chart.surge.sh/marvel_force_chart_img/top_captainmarvel.png") )
edges.append( Edge(source="Captain_Marvel", target="Spiderman", type="CURVE_SMOOTH"))
Push the app to Streamlit sharing
For deploying the component I used Streamlit sharing, which for now is invite only, but you can sign up here. After your invite to Streamlit sharing comes in - the process to deploy your app is simple:
- Upload the code to a public GitHub repo
- Login to Streamlit sharing
- Deploy your app with 3 clicks (New App > Choose Repo > Deploy).
- Done 🎈
If you'd like to read a bit more about the deployment process on sharing - check out this tutorial.
Conclusion
After that we're done and congrats! We just finished the complete development process from idea to implementation in breathtaking speed 🎉. You can see an example of the Streamlit-Agraph component via this sharing app and the source code can be found here.
If you have any questions or have ideas on how to improve the component feel free to leave a comment below or to message me via the following channels:
- @ChristianKlose3 on Twitter
- Github ChrisChross (create a new Issue)
- Streamlit Community


Comments
Continue the conversation in our forums →