
Auto-generate a dataframe filtering UI in Streamlit with filter_dataframe!
Learn how to add a UI to any dataframe
Tutorials
by

Built-in charts get a new look and parameters! 📊
Create beautiful charts with one line of code
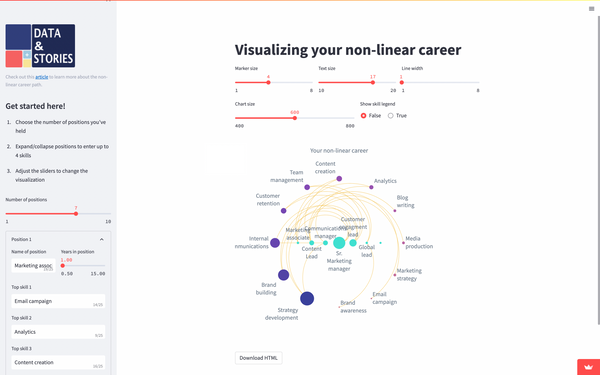
Monthly rewind > July 2022
Your July look-back at new features and great community content

The magic of working in open source
How we build our open-source library and release new features
How to enhance Google Search Console data exports with Streamlit
Connect to the GSC API in one click and go beyond the 1,000-row UI limit!
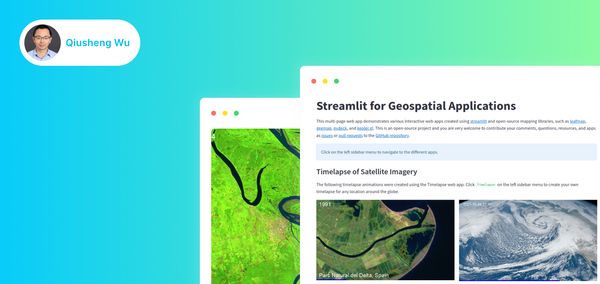
Qiusheng Wu uses Streamlit to build a popular geospatial application
Learn how Qiusheng created Earth Engine web apps with geemap
Monthly rewind > June 2022
Your June look-back at new features and great community content
JULO improves financial inclusion in Indonesia with Streamlit
Learn how JULO went from manual underwriting to automated credit scoring and a 22-member data team
Make your st.pyplot interactive!
Learn how to make your pyplot charts interactive in a few simple steps
Observing Earth from space with Streamlit
Learn how Samuel Bancroft made the SatSchool app to teach students Earth observation